
Welcome:
Login
|
Sign Up
|
About CircleID
Follow:
|
|


|
||
|
||
Every month, top-level domain (TLD) registry operators submit activity reports to the Internet Corporation for Assigned Names and Numbers (ICANN). Among other fields, these reports record the number of Domain Name System (DNS) queries each registry received over UDP and TCP transport mechanisms. Because the reports are collected and made public, they offer something the DNS community rarely gets: a consistent, long-running longitudinal, cross-registry view of query traffic that is reported by the operators themselves.
We recently collected, parsed, coalesced, and analyzed these reports for the largest TLDs based on total query volume, covering 2013 through mid-2026. In this blog post, we’ll share three observations from that data set including: 1. the scale at which .com operates relative to other TLDs, 2. what the anomalies in the data tell us about capacity planning, and 3. what the shift in UDP/TCP transport mix reveals about the operational benefits of the algorithm rollover Verisign completed in late 2023.
The figures below are derived entirely from published ICANN monthly registry activity reports, using the reported UDP and TCP query counts for each TLD. Registry operators may differ in exactly how they count and report queries and responses. Under ICANN’s established reporting schedule, monthly registry activity reports are made publicly available three months in arrears. The numbers in this post measure the DNS query volume and their transport mechanism arriving at each registry’s authoritative name servers.
The reported figures reflect properly formatted DNS queries and successfully transmitted responses; they are not a measure of all traffic reaching the authoritative name servers. For the TLD servers operated by Verisign that are included in the study (.com and .net), the counts exclude malformed queries, non-DNS traffic directed at the name servers, and attack traffic outside of the DNS protocol itself, all of which Verisign observes in substantial quantity and none of which appears in the reported figures1.
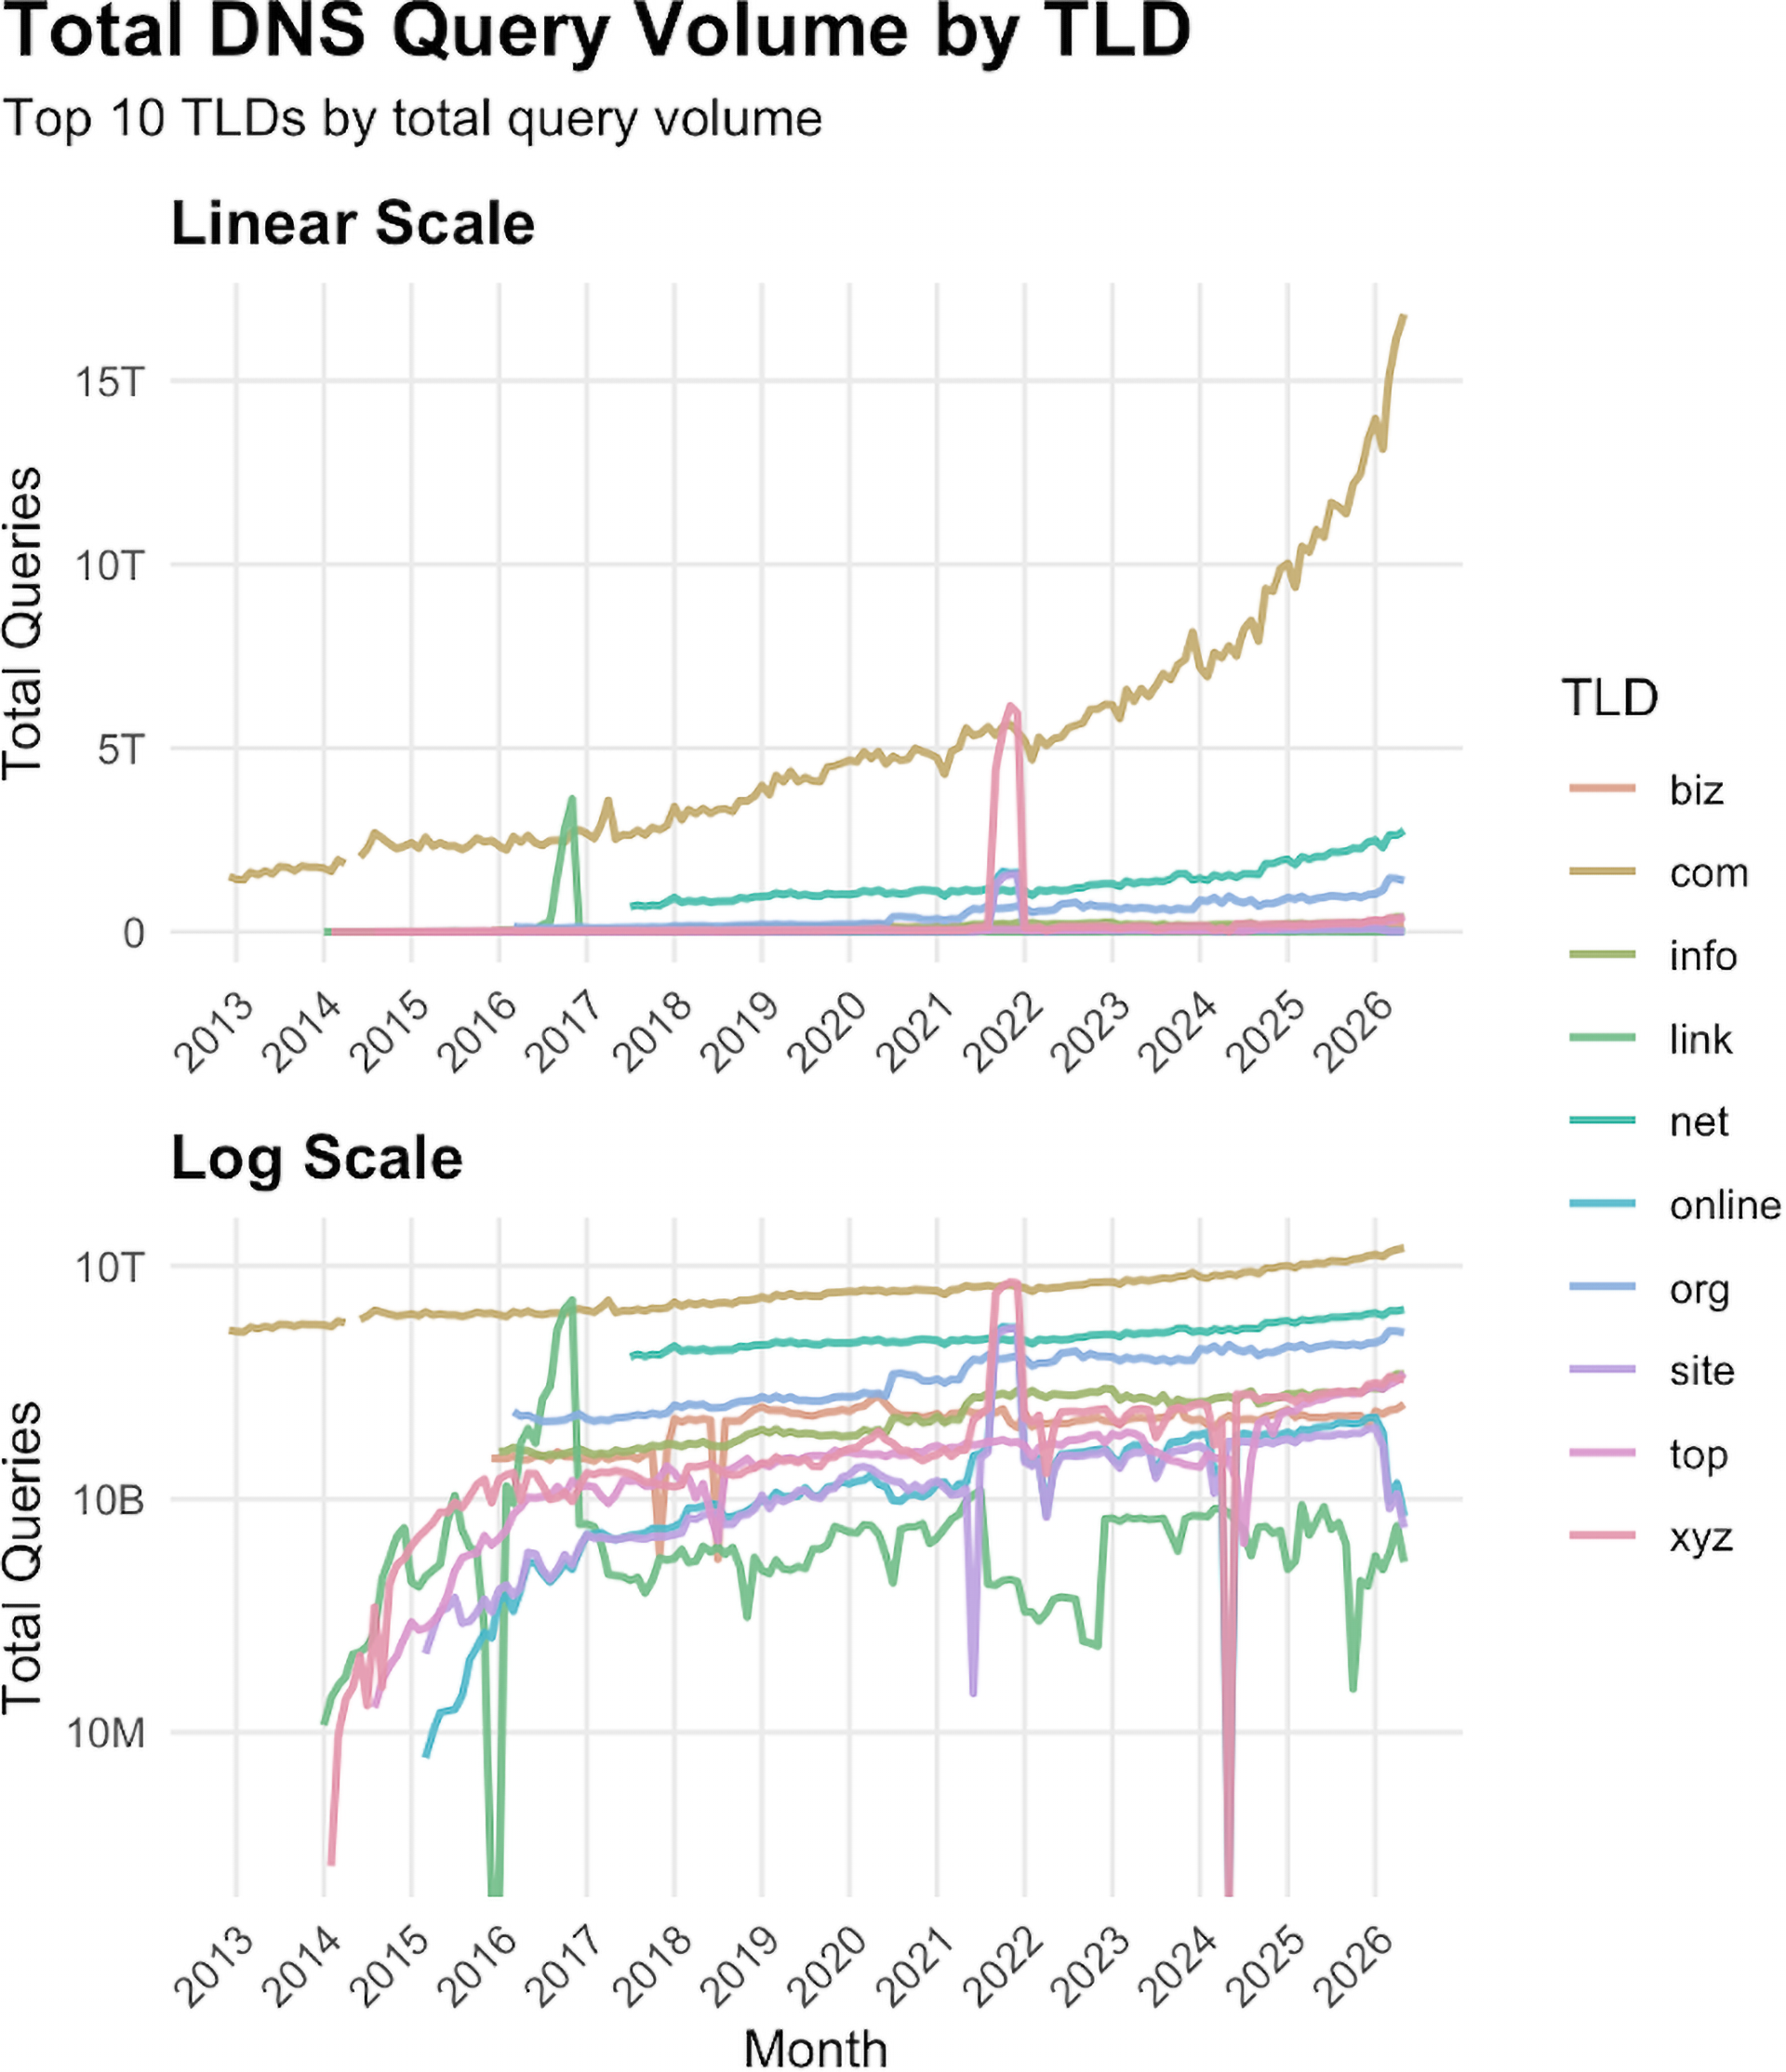
The first observation is the separation between .com and everything else.
In 2013, .com’s authoritative name servers answered approximately 1.5 trillion queries per month. By 2021, that figure had passed 5 trillion. As of mid-2026 it is approximately 17 trillion queries per month.
The growth rate for .com continues to accelerate. Monthly volume took roughly eight years to triple from its 2013 level, then tripled again in about five years. The steepest portion of the curve is the most recent two years. The last 24 months are even more steep with monthly volume nearly doubling from approximately 9 trillion queries in mid-2024 to approximately 17 trillion in June 2026.
.net has grown steadily as well, from approximately 0.7 trillion monthly queries in 2017 to approximately 2.7 trillion today. Apart from .org, no other TLD in the data set sustains more than one trillion queries per month. Most of the largest TLDs introduced in the last decade operate at a fraction of .com’s monthly volume.
The long-term view also contains a handful of brief sharp anomalies. In late 2016, .link rose to approximately 3.6 trillion queries in a single month before returning to its prior baseline. In late 2021, .xyz exceeded 6 trillion queries over a similar short interval, with a smaller simultaneous anomaly visible in .site and .online.
We can’t determine from the published reports alone what caused any individual event. Anomalies of this shape are generally consistent with distributed denial of service (DDoS) attacks, misconfigured or misbehaving software, or botnet activity of the kind we’ve described previously. What we can observe is their magnitude relative to ordinary operations elsewhere.
At their peaks, these events reached roughly the volume .com was handling on average in the same period. Put differently, the largest single-month anomaly visible anywhere in this data set is well below what .com now answers in an average month.
This is the operationally grounded and pragmatic meaning of designing for capacity rather than average demand. Published monthly query statistics provide a useful baseline for understanding long-term trends but do not capture the full range of traffic conditions that authoritative DNS infrastructure must accommodate, particularly short-duration traffic surges and anomalous events. Capacity planning must therefore account for substantially higher instantaneous traffic levels than monthly averages alone would suggest, including both expected growth and unexpected events.
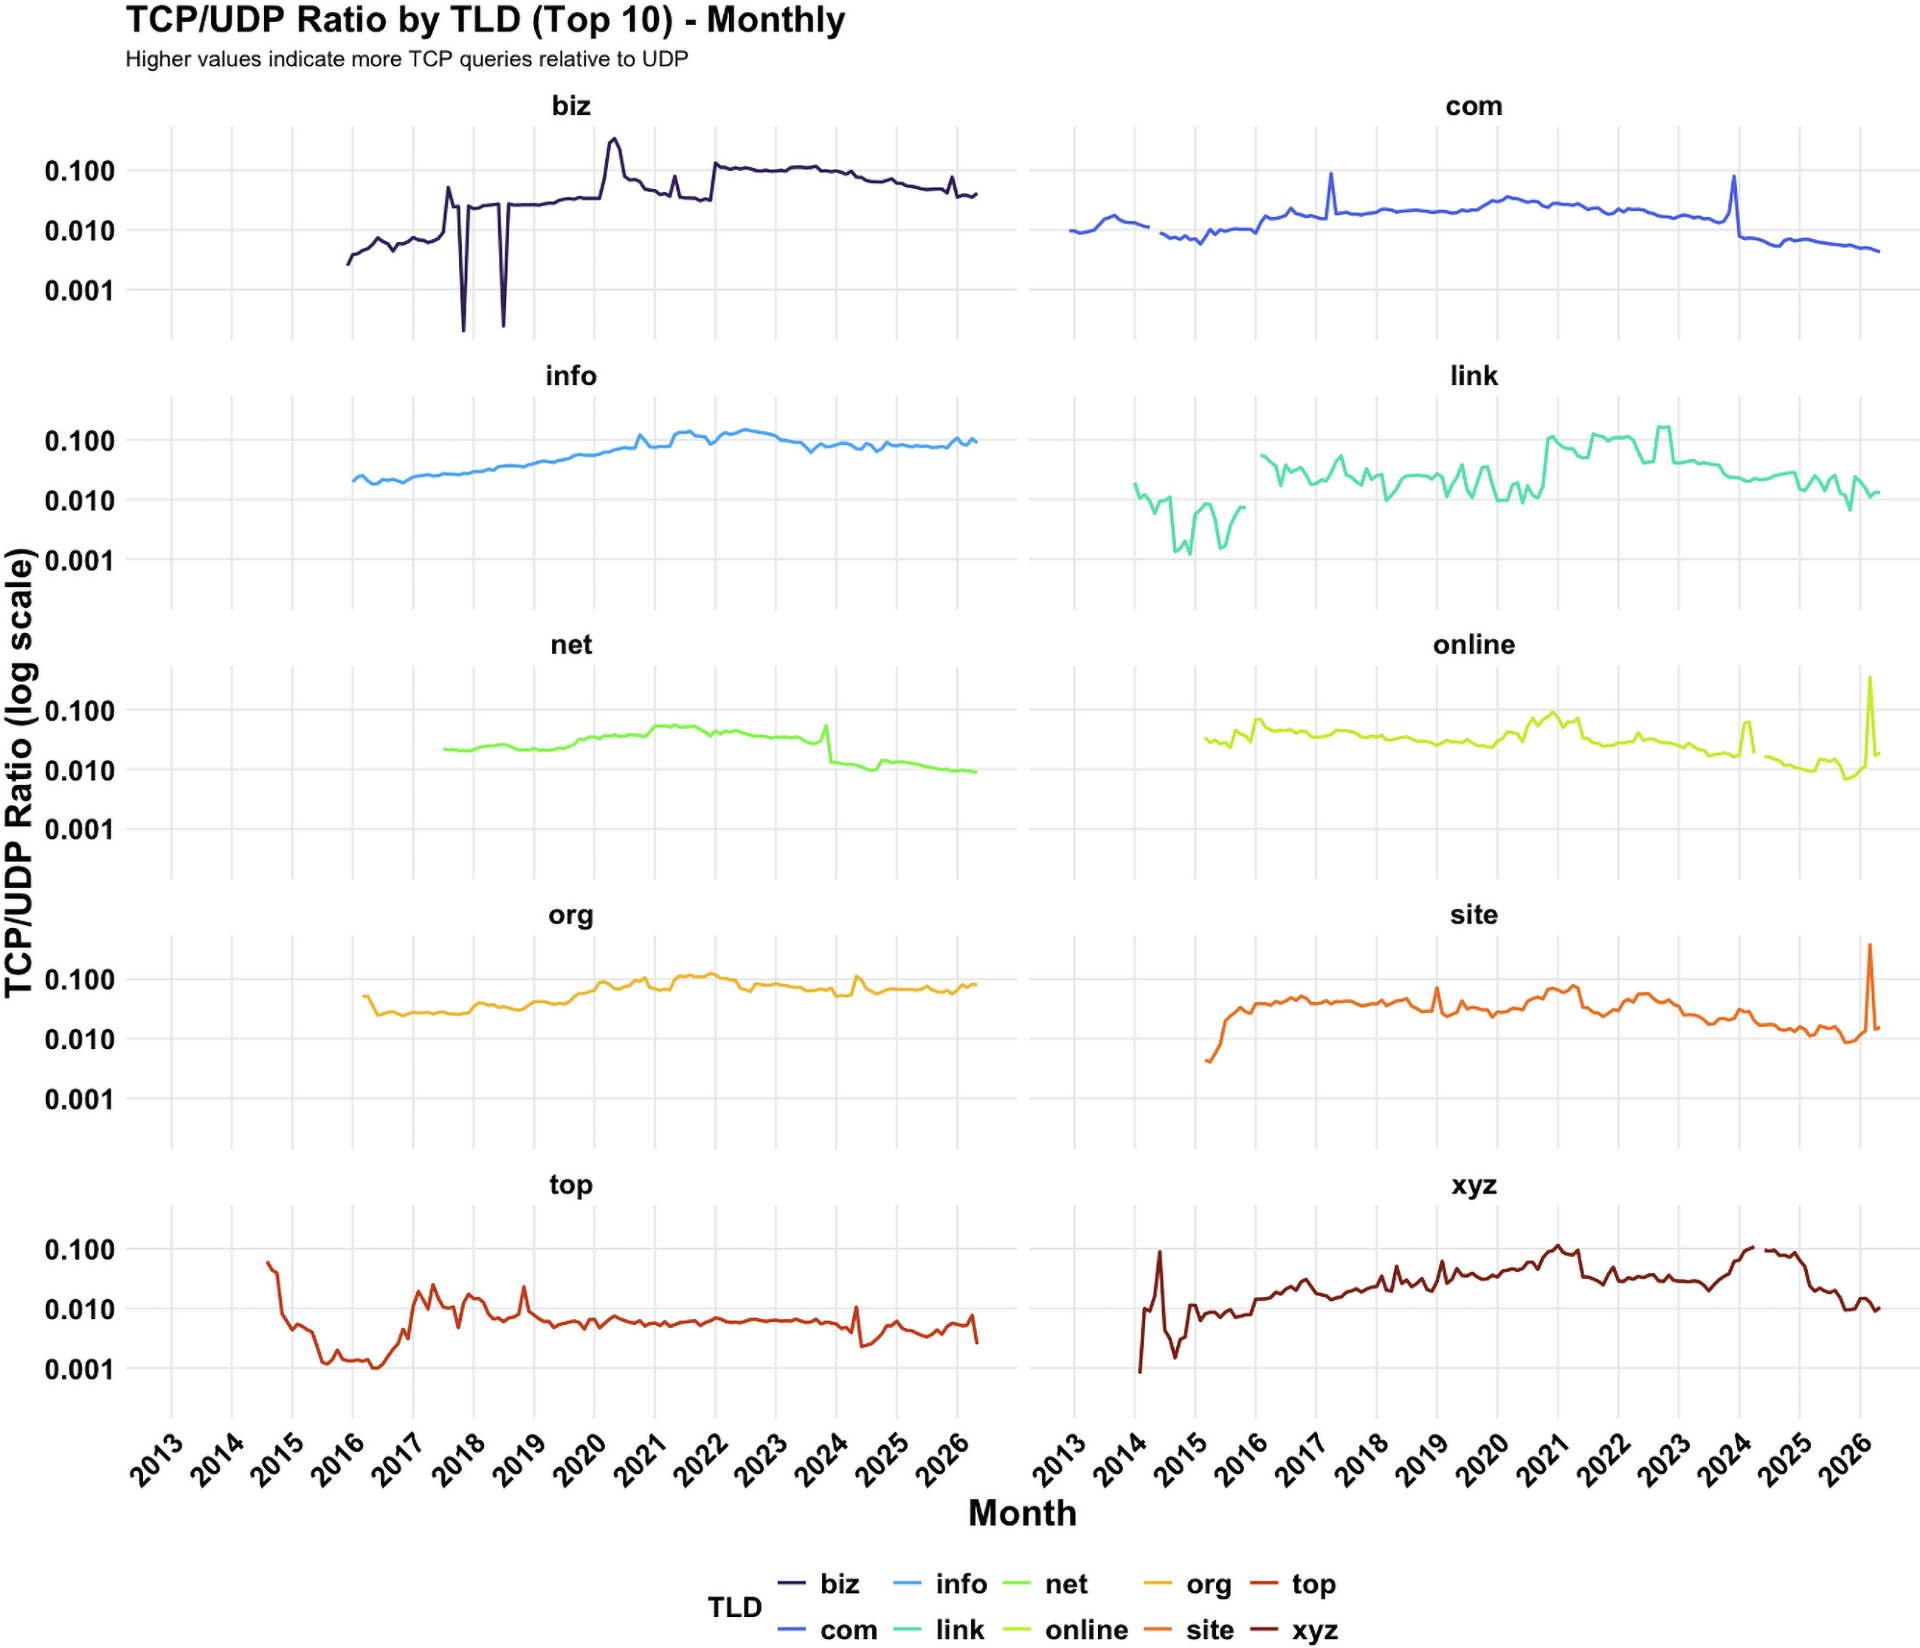
The second measurement derived from the ICANN activity reports track the ratio of TCP to UDP queries received by each TLD.
TCP is a connection-oriented protocol that guarantees data delivery and accuracy by tracking packets and retransmitting errors, making it highly reliable but at the expense of speed. In contrast, UDP is a connectionless protocol that streams data continuously, prioritizing speed over perfect reliability.
The majority of DNS traffic is carried over UDP, which allows the global DNS infrastructure to process trillions of daily queries at maximum speed. When a response exceeds what the requester can accept in a single UDP datagram, the server returns a truncated response, and the resolver retries the query over TCP. That retry costs additional round trips and connection states on both ends, which incurs end-user latency during the DNS resolution process. A lower TCP-to-UDP ratio therefore generally indicates that more responses are being delivered in a single and efficient exchange.
For most of the past decade, .com’s TCP/UDP ratio held in the range of approximately 0.03 to 0.04, meaning for every 100 responses carried over UDP, only 3-4 were carried over TCP. Beginning in late 2023, the ratio briefly rose, then declined sharply, and has continued to decline since, reaching approximately 0.004 by 2026. .net shows the same pattern over the same interval, falling from approximately 0.05 down to approximately 0.009. These are small numbers, and that is the point. At .com’s volume, and given our focus on high availability operations, we have a long-established preference for UDP traffic. The difference between a TCP/UDP ratio of 0.03 to 0.04 and 0.004 is measured in the hundreds of billions of avoided connections per month – preserving more capacity to absorb both expected growth and unexpected events.
Both the brief rise and the sustained decline are the consequences of a change we described here in 2023, in which we transitioned our TLDs from DNSSEC algorithm 8 (RSA/SHA-256) to algorithm 13, ECDSA Curve P-256 with SHA-256. We completed the .net rollover in early November 2023 and the .com rollover in December 2023, with the algorithm 8 DNSKEY records and signatures removed over the following days.
The temporary rise seen in Figure 2 is the rollover itself. During the transition, a zone publishes signatures and DNSKEY records for both algorithms simultaneously, which increases response sizes and thus higher UDP truncation and TCP retry rates ensue. The decline that follows the transition is the benefit we observe afterwards. An ECDSA signature is 96 bytes smaller than the RSA signature by using 64 bytes instead of 160 bytes (our previous RSA key size was 1,280 bits). Smaller signatures mean smaller responses, fewer truncated UDP answers, fewer TCP retries, and ultimately faster answers for requesters.
Multiplied across trillions of responses per month, that 96 bytes is a meaningful reduction in bandwidth, in server state, in the operational headroom consumed by routine traffic, and the overall DNS performance received by requestors. As these longitudinal ICANN activity reports illustrate, choices about algorithms, response sizes, and protocol behavior are ultimately choices about security, stability, and resiliency – principles that guide Verisign’s decisions generally.
The 2023 algorithm rollover is a useful precedent for a larger transition now approaching, because it demonstrates the relationship that response size determines transport, and transport determines latency and operational cost.
Post-quantum signature algorithms are considerably larger than what DNSSEC uses today. NIST has standardized ML-DSA, which at its minimum parameterization, ML-DSA-44, carries a 2,420-byte signature and a 1,312-byte public key. An ML-DSA-44 signature is roughly 38 times the size of the ECDSA P-256 signatures that replaced our RSA signatures in 2023. (There aren’t yet many other standardized post-quantum signature algorithms, and the other one standardized by NIST has a starting signature size of 7,856 bytes.)
DNSSEC has benefited since deployment from a fortunate alignment of the signature sizes available at the time fitting inside the message sizes DNS was built around, letting a signed response usually complete in a single UDP exchange. Post-quantum signatures break that alignment.
The practical consequence is that a naïve post-quantum DNSSEC deployment with a post-quantum cryptography (PQC) algorithm as direct “drop-in” replacement for ECDSA or RSA would truncate routinely and push a large fraction of queries to TCP. The decline we measured after 2023 came from removing 96 bytes per signature. Some post-quantum algorithms propose to add thousands.
Verisign is committed to a post-quantum algorithm transition to ensure the security and stability of the internet; however, we also must consider how to get there without trading away the operational properties that make the DNS dependable at scale today and for the last several decades.
The practical consequence is that a naïve post-quantum DNSSEC deployment would truncate routinely and push a large fraction of queries to TCP.
That is the problem current evaluation and deployment is running into, and why the shape of the solution matters. Cloudflare’s ML-DSA-44 support on 1.1.1.1 carries a 2,420-byte signature in every signed response, which is what makes their experiment valuable by measuring how the ecosystem behaves when responses routinely exceed the UDP budget and fall back to TCP.
Verisign’s contribution to this problem addresses signature size directly. Verisign’s Merkle Tree Ladder (MTL) technology approaches the same requirement from the other end. In MTL, each post-quantum signature covers a “ladder” – a set of one or more Merkle tree nodes that together authenticate multiple DNS record sets. The per-response overhead for an individual DNS record set is an inclusion proof, with the full signature on a ladder retrieved only when a verifier needs a ladder it does not already have. The security assurances remain the same; however, the result is a path to post-quantum DNSSEC that does not require the DNS to absorb a step change in response size for every DNSSEC-protected transaction to get there.
The DNS has always been shaped by what fits in a packet. That constraint is usually invisible and only surfaces in the aggregate via longitudinal measurements such as the ICANN activity reports. Removing 96 bytes from a signature moved a measurable share of .com’s traffic off TCP, even as total monthly query volumes exponentially grew. Some post-quantum algorithms, if deployed directly, would move that same quantity thousands of bytes the other way resulting in substantially more queries over TCP and the concomitant negative impact to overall DNS responsiveness.
The transition to post-quantum is necessary and the question is how to get there without giving up the operational properties that make the DNS dependable at scale. That is the work Verisign’s MTL technology supports, and why we are promoting it for potential standardization and making it available under a royalty-free license.
Verisign will continue to publish what we observe and contribute what we build through the standards process. The cryptography protecting the DNS will change. Our commitment to its security, stability, and resiliency will not.
Sponsored byVerisign

Sponsored byVerisign

Sponsored byIPv4.Global

Sponsored byRadix

Sponsored byWhoisXML API

Sponsored byCSC
Sponsored byDNIB.com


A World-Renowned Source for Internet Developments. Serving Since 2002.