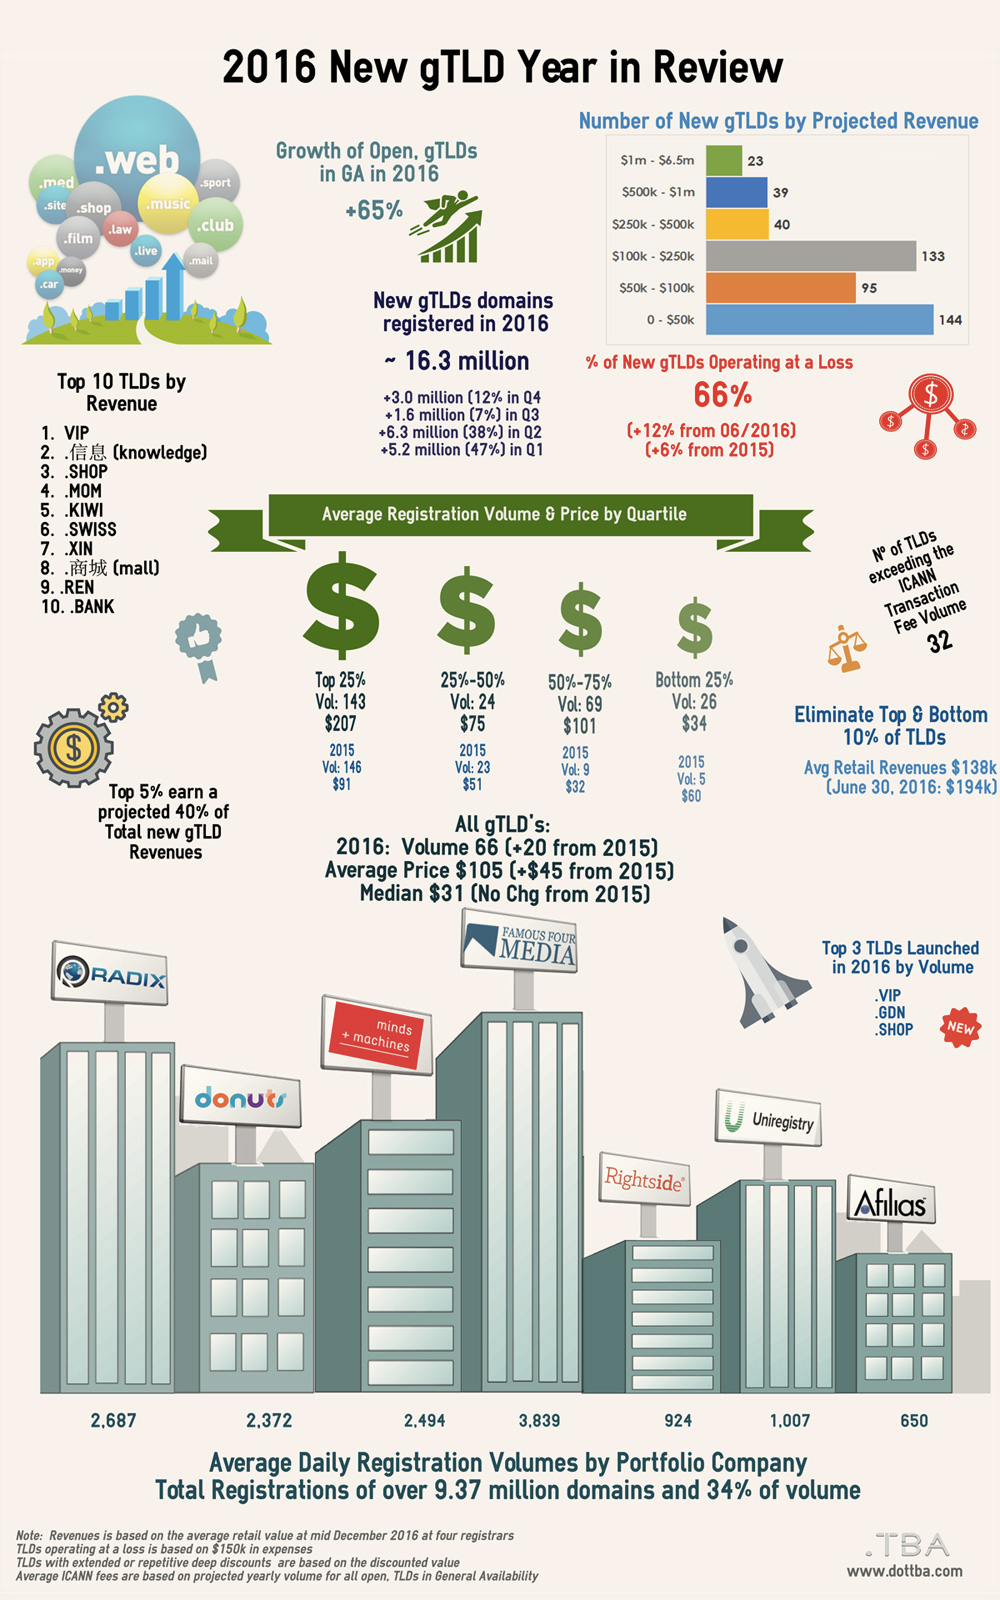
This post provides an overview of The 2016 New gTLD Year in Review infographic, reflecting on some of the intriguing highlights of the gTLD industry.
The data analyzed within the infographic is based on the following:
– New Top Level Domains (TLDs) contained in the data set reflect open TLDs and exclude single registrants such as brands
– For greater insight, TLDs have been separated into four quartiles or ‘tiers’ with tier 1 being the top 25% and tier 4 being the bottom 25%
– Initial registration upswings have been eliminated with TLDs in the data set to be in General Availability for at least 60 days
– Top ten based on projected yearly revenues based on daily registration volumes
– Registry revenues do not include premium name sales as dependable revenues are not available
– Operational losses are based on TLD revenues with a conservative $150k in expenses
– Revenues are based on the average retail price over four registrars (101Domain, eNom, GoDaddy and United Domains) in December 2016
– If significantly low registration pricing (less than $5) was employed on an extended or repetitive basis, the lowest price was used. This is a change from prior comparisons where the TLD was removed from the data set.
* * *

Top Level Domain Statistics and Business Implications 2016 Overview
- The dataset analyzed contains 475 TLDs that were in general availability for at least 60 days (an increase of 63 over 2015)
- Average number of registrations per day is 66
- Top 25 TLDs account for 40% revenues and 12% of registration volumes (significant change from 2015 with half of revenues accounting for half of the registration volume)
- Less than 4% of TLDs will exceed ICANN’s minimum yearly fee
- Largest group of TLDs are in the $20 - $25 retail price range followed by the $25 - $30
- Average revenue of all gTLDs is $252k
- Average retail prices vary ($34.14 to $206.70) within each tier differ yet the median price variance is less significant ($28.49 to $33.74)
- All tiers have a ‘very weak’ correlation between price and volume
- Based on today’s data, 66% of TLDs are projected to operate at a loss for the next year based on conservative, yearly expenses of $150k; with over 400 TLDs belonging to portfolio companies, the percentage decreases
2016 Insights from gTLD Statistics and Business Implications by Quartile
Tier 1: Trailblazers – Leading TLDs with a consistent gap over the other three tiers based on higher prices and consistent volume
- Average retail price of $207 (increase from $91 in 2015) and a median of $32.99 (decrease from $35 in 2015 but lower than tier 3 of $33.74)
- 5 out of 10 of the highest average retail priced TLDs are in tier 1 (.auto, .car, .cars, .security, .protection)
- 70% of TLDs in tier 1 in 2015 remain in tier 1 in 2016; However, 51% had a reduction in their retail price on average $12.47 with a median of $3.72 resulting in an average registration volume increase of 48 but with a mean volume decline of 15
- Projected yearly volume remains relatively unchanged with a small decrease of 2.2% over 2015
- 34% and 42% of TLDs that went into General Availability in 2015 and 2014 respectively are in tier 1
- Average TLD length is up to 5.45 characters in length
- Deeply discounted TLDs in tier 1 include .loan, .online, .site, .gdn, .bid, .tech
- Tier 1 TLDs include: .vip, .shop, .mom, .bank, .design, .nyc, .games, .city, .lawyer
- More precise pricing needs to be tracked to provide comparable yearly revenue projections and analysis
Tier 2: Path Finders – Finding their Way
- Average retail price jumped from $51 in 2015 to $75 in 2016; However, the median price had a small increase moving from $29.99 to $30.49
- 67% of TLDs in tier 2 in 2015 remain in tier 2 in 2016; However, 31% had a reduction in their retail price on average $1.82 with a median decrease of $8.09 resulting in an average registration volume decrease of 1 but with a median decrease of 8
- 32% and 64% of TLDs that went into General Availability in 2015 and 2014 respectively are in tier 2
- Average TLD length is up to 6.05 characters in length
- Average volume in 2016 increased just over 4.1% to 8,728 from 8,387 in 2015
- Tier 2 TLDs include:.gift, .racing, .video, .taxi, ,bar, .earth are in the second tier of gTLDs
Tier 3: Campers – Niche groups of TLDs
- Average retail price in tier 3 is $101.27 and a median price of $33.74
- 67% of TLDs in tier 3 in 2015 remain in tier 3 in 2016; However, 26% had an increase in their retail price on average $3.67 with a median reduction of $4.07 resulting in an average registration volume increase of 2 but with a median decrease of 3
- 21% and 71% of TLDs that went into General Availability in 2015 and 2014 respectively are in tier 3
- Average TLD length is up to 6.38 characters in length
- Tier 3 TLDs include: .estate, .holiday, .codes, .cards, .soccer, .accountants, .toys
Tier 4: Hikers – Determining a pathway up!
- Lowest pricing amongst all tiers with an average retail price of $34.14 (up from $31.62 in 2015) and a median price of $28.49 (down from $28.74 in 2015)
- 80% of TLDs in tier 4 in 2015 remain in tier 4 in 2016; However, 29% had an increase in their retail price on average $4.92 with a median reduction of $2.35 resulting in an average and median registration volume decrease of 2
- Projected volume has grown due to TLDs who have offered significant discounts but with total revenues remaining in tier 4
- 20% and 75% of TLDs that went into General Availability in 2015 and 2014 respectively are in tier 4
- Average TLD length is up to 6.29 characters in length
- Tier 4 TLDs include: .joburg, .cologne, .florist, .actor, .supply, .gripe, .sarl
gTLD Business Implications for 2017
- As the number of new TLD delegations tapers off, 2017 will be interesting as the industry shifts from launches to operations will play a bigger role. As such, TLDs rising to tier 1 at the end of the year will likely be diverse from prior years
- Average registration volumes have increased to 23,900 an average increase of 5,650 over 2015
- Number of TLDs offering deeply discounted registrations has also increased over 2015
- Average retail prices have increased by $45 over 2015 with almost no change in the median price $-0.038
- Top 5% of TLDs account for 40% of all projected revenues
- In 77% of all cases, the singular TLDs ranks higher than the plural TLD i.e. .loan/.loans, .game/.games, .accountant/.accountants
- Volume of IDNs in tier 1 have increased to 37% (up from 26% in 2015), tier 2 and tier 3 each have 15% (tier 2 down from 22% in 2015 and tier 3 up 11%). Tier 4 remains unchanged with 48%
- Premium name revenues have not been taken into account which can have significant impacts on the financial performance of a TLD
Please do not hesitate to contact us for any questions, insight or items to consider for future analysis.
NORDVPN DISCOUNT - CircleID
x NordVPN
Get NordVPN
[74% +3 extra months, from $2.99/month]


