

|
||
|
||
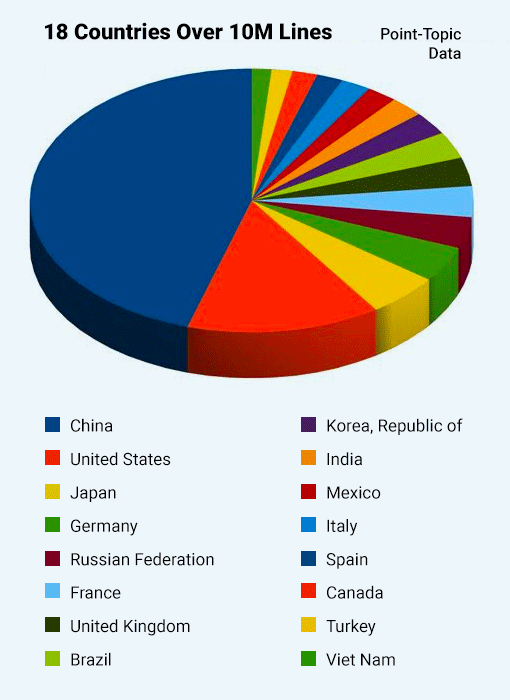
 55%-60% of landline broadband users are in the “Global South,” about 500M. The South is 65%-70% if you include “wireless-only” many of which are 4G LTE at 10 megabits or more (see chart below).
The gap is widening rapidly and will increase by well over 70M in 2018. Six large developing countries grew at 5% or more in the last year, compared to only one in the developed world. China is adding ~30M more each year. Most developed countries are between 75% and 95% connected. That leaves little room for growth (see chart below). The strong majority are not native English speakers or European in ancestry.
The blue dominating the chart is China, with 313M broadband landlines. That’s more than three times as many as the U.S., in red. India added 160M 4G subs in the last five quarters.
The developed countries are adding new users slowly if at all. Brazil, Mexico, and Indonesia are less than half connected and can grow at a ferocious rate. Brazil and Africa are flat but will grow again as the economy improves.
I wrote this article when questioned about my comment, “Many Internet users, in my opinion, a majority, believe that decisions about the Internet should not be dominated by the U.S. and allies. (Among those who consider the subject.)”
The U.S. and Western Europe are now only about ~25% of the Internet, a figure well known to experts. China is about 1/3rd of the Internet. India soon will pass the U.S. in users if it hasn’t already. Africa as well.
I made a point of saying “in my opinion” because there is no hard data, particularly on the overlap between wireless and wired Internet users in much of the world.
2/3rds of the governments in the world, representing approximately the same % of the world population, identified with the global South in 2012 at the ITU WCIT, which I attended.
What do I mean saying Global North & South?
Since at least 2012, there has been a clear split among nations on how to govern the Internet. The most common terms are the Global North & the Global South, although the split is not precisely geographical. Australia usually votes with the North and Russia with the South. On the State Department ITAC, the parties are referred to as “The Group of 77” versus “us.” The BRICS have taken a leadership role, backed by almost all of Africa, Latin America, the Arab World and Asia. Sometimes It’s described as “The Developing World” vs. “The Developed World.” It’s taboo to say “Rich Countries” vs. “Poor Countries.”
The essence of the debate is whether the decisions should be made by existing institutions like ICANN, 3GPP, and the giant multinationals (“the market”) or by institutions more representative of the world Internet today.
There is no way to accurately estimate whether the Internet users in each country agree with their government.
My guess is that many of the people in that 2/3rds of the world agree with their governments on this, and hence a majority of the world Internet users. At international events I’ve attended, the sentiment has often been expressed. I remember sitting with a group of Africans in Dubai. One said, “The Americans, they are so greedy.” Heads nodded. But this is anecdotal.
It makes sense for most people in poorer parts of the world to not think things should be dominated by the richer countries, especially the U.S. The giant multinationals, most of which are American, rarely higher locally, evade taxes with remarkable efficiency, and moving an increasing amount of income from poorer countries to their home base.
I think this isn’t right. I have a Rawlsian sense of justice. In addition, while the public presentation of the U.S. is freedom and democracy, the actions of the U.S. government are far more mercantile, protecting U.S. corporate interests. I can supply details.
Again, there is no hard data on individual opinions, only on government point of view.
The data below is from Point-Topic, a reliable source, professionally priced. This list of 16 countries is all the nations with 10M landlines or more; including the other 100 countries in Point-Topic, data wouldn’t change the conclusion.The first chart in the number of landline connections at the end of September 2017. The second chart if the growth rate. I’ve separately guessed at the number of “wireless-only” connections, where the data is less firm.
In return for giving me access to the data, I’ve marked all but the Top 10 countries “North” or “South.” The ITU and OECD have freely available data, but Point-Topic is generally more up to date and thoughtful in their numbers.
Originally published in Net Policy News.
Sponsored byDNIB.com

Sponsored byVerisign

Sponsored byIPv4.Global

Sponsored byWhoisXML API

Sponsored byCSC

Sponsored byRadix

Sponsored byVerisign
