
Welcome:
Login
|
Sign Up
|
About CircleID
Follow:
|
|
|


|
||
|
||
The canonical specification of the DNS that is normally cited are the pair of quite venerable RFCs, RFC 1034, “Domain names—concepts and facilities”, and RFC 1035, “Domain names—implementation and specification”, both published in November 1987. However, these two specification documents are just the tip of a rather large iceberg. One compendium of all the RFCs that touch upon the DNS lists some 292 RFCs. That observation implies that to claim that the DNS is essentially unchanged over this forty-year period might be a bit of a stretch, but nevertheless, the DNS fundamentals have been constant. Those additional 292 RFCs illustrate the observation that we’ve spent a huge amount of time and effort over the past forty years focused on tinkering at the edges! Maybe this is a bit of an overly harsh judgment, as there have been some changes to the DNS in this period that are more than just tweaking a bit or two. If I were to nominate one change that could be considered a major DNS innovation in this period, then I would have to nominate the security framework for DNS, DNSSEC.
DNSSEC adds a digital signature to DNS resource records, allowing a client to determine the authenticity and currency of a DNS answer if they so choose. You would think that at this time, with a widespread appreciation of just how horrendously toxic the Internet really is, anything that allows a user to validate the response that they receive from a DNS query would be seen as a huge step forward, and we should all be clamouring to use it. Yet the extent of take up of DNSSEC is an active question where there is no clear answer. In some areas, there is visible movement and visible signs of increasing adoption, while in other areas, the response is less than enthusiastic. Many operators of recursive DNS resolvers, particularly in the ISP sector, are reluctant to add the resolution steps to request digital signatures of DNS records and validate them, and very, very few DNS stub resolvers on users’ devices at the edge of the network have similar DNSSEC validation functionality. Over on the signing side, the uptake of adding DNSSEC signatures to DNS zones is, well, variable.
But aside from these vague descriptions of “very few,” and “unenthusiastic,” and “variable”, can we use a more precise and repeatable metric? Can we perform such a DNSSEC measurement over time and see if we are managing to improve the picture relating to the use of DNSSEC?
This sounds like an easy task, but there are some inherent complexities here that are challenging to overcome, and here I’d like to look at the most recent measurement contribution to this DNSSEC measurement picture from APNIC Labs and relate how this measurement fits into the overall picture of DNSSEC adoption.
There are two parts to DNSSEC: the adding of digital signatures to DNS responses, or “signing,” and the validation of these signatures within the process of resolution of DNS names. Let’s have a look at each of these parts, in turn, to see how we measure the uptake of DNSSEC and what kind of result we’re seeing.
It’s such a simple question: “What fraction of the DNS name space has been signed with DNSSEC?” The question assumes two capabilities, namely that we have some idea as to the overall size of the DNS name space, and secondly, that we can determine the count of signed named.
An exact count of all domain names on the Internet is a practical impossibility these days. I guess that it would be possible in theory if every DNS zone administrator allowed full zone transfers, and every zone was able to be fully enumerated. In such a world, a DNS crawler could start at the root zone and, follow all the zone delegation records and integrate across the entire DNS name hierarchy. However, much of the DNS is deliberately occluded, and such an approach of top-down crawling is just not viable, even if all DNS zones were enumerable, which is increasingly not the case. Any such DNS census becomes an exercise in guesswork and inspired estimations. So, let’s just cut to the chase and use AI instead!
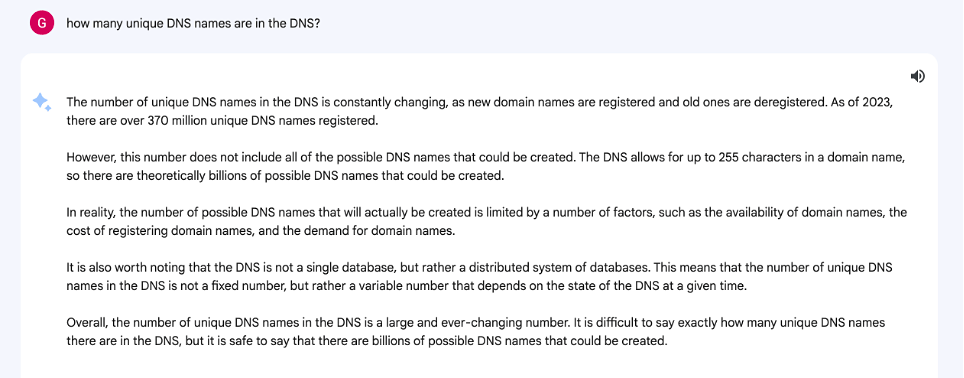
I suspect that a total count of 370M names in the “defined” DNS namespace is a bit low, but I have no alternate data source that I can use to justify that suspicion!
On to the next question: “How many of these names are DNSSEC-signed?” Again, let’s just dispense with the formalities of mathematics, statistics and science, and just ask AI!
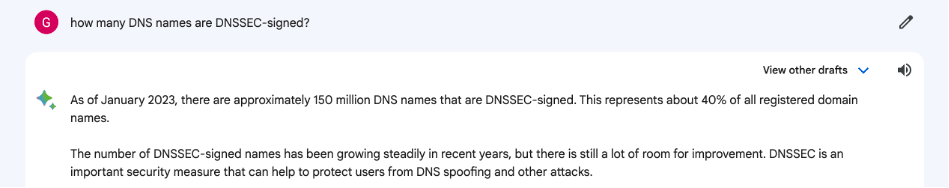
Bard suggests that the number is around 40% of the 370M DNS names that are DNSSEC-signed. Can we believe this answer? It’s hard to say without some understanding of the reference material it has used to generate this response, which is not forthcoming in my Bard client.
Let’s look elsewhere to see if other metrics might agree with this rather surprisingly high number of 40%.
In the root zone, there are 1,464 top-level zones and 1,354 DS records. This implies that in the root zone, some 92% of delegated top-level zones are DNSSEC-signed. Maybe that 40% level might be plausible after all.
But there is more data we can use to look at this question. We can peek down into 2 of the most popular top-level zones, .com and .net. Of the second-level zones in these two of the most populated top-level domains, the zone’s registry operator, Verisign, reports that the current DNSSEC signing rate is 4.3% in .com and 5.3% in .net (Figure 1). That’s some 7M .com second-level domain names and some 675K .net second-level domain names. Considering that these are the two most populous top-level domain names, then maybe that 40% value is now looking less plausible.
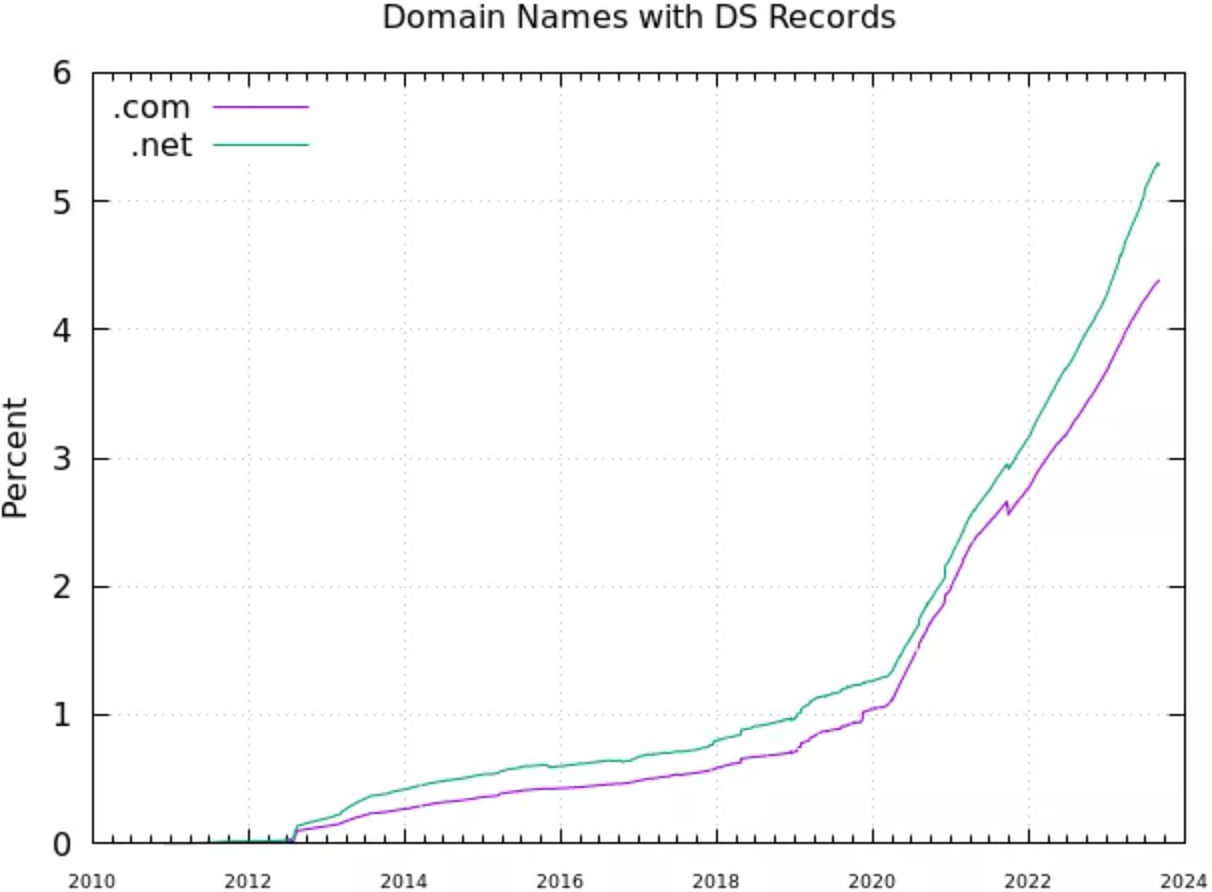
It is interesting to observe the pronounced jump in signing of zones in .com over the past three years, where the number of signed zones has increased from 1.5M at the start of 2020 to some 7M today.
A recent (February 2023) report on this question was published by the folk at SIDN. They reported that some 60% of all .nl domains are DNSSEC-enabled (Figure 2). This appears to have been a result of positive incentives for DNSSEC adoption, including financial incentives.
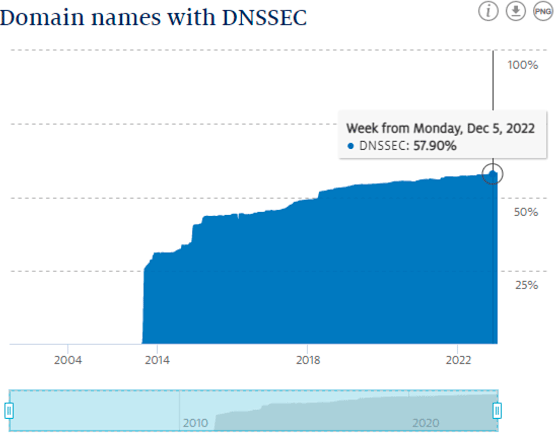
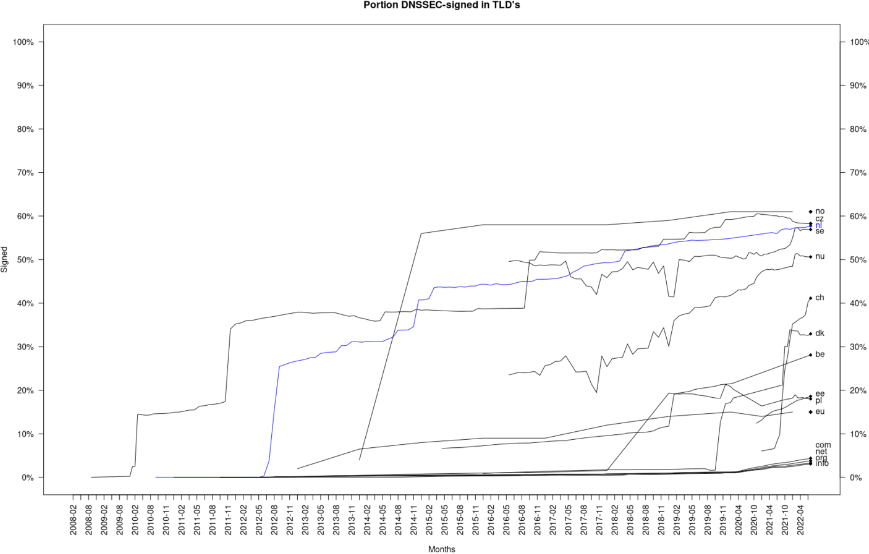
Figure 3 shows the development of DNSSEC in the European ccTLDs, as of August 2022. Like the Dutch .nl zone, the Czech (.cz), Norwegian (.no) and Swedish (.se) zones all have adoption rates exceeding 50 percent. Recent deployments of DNSSEC include Switzerland (.ch) and Denmark (.dk).
ISOC has assembled the larger picture of DNSSEC adoption using the various country-code TLDs in their Deploy360 reports. It does not purport to represent to what extent 2LDs in each ccTLD are DNSSEC signed, but it does indicate a lack of adoption by ccTLD operators across central Africa and Western Asia (Figure 4)
These selective views all point to a highly varied picture of adoption of DNSSEC-signing. Can we reduce all these varied perspectives to a single index of “The proportion of all DNS names that are DNSSEC signed?” Bard appears to have done so with nonchalant ease to come up with its 40% number, but a systematic approach to answer such a question still appears to be somewhat elusive. We have individual reports of some top-level domains of between 0% and 60% of their second-level domains being DNSSEC enabled, but we are still no better off in trying to understand the larger picture of the extent of DNSSEC signing.
Maybe we can leave that part of the question at this point and move on.
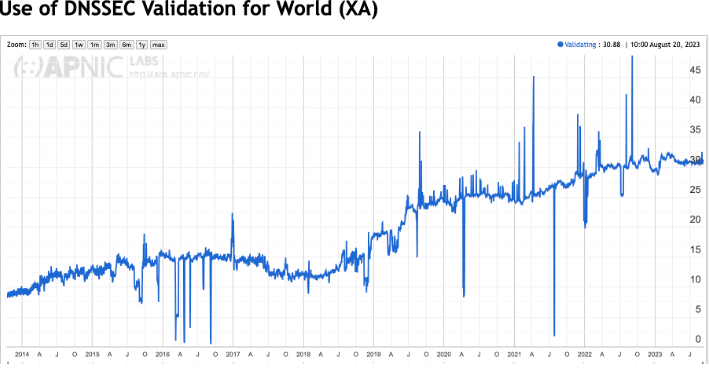
Signing a zone is only half the DNSSEC story. The other half of the task is validating these signatures. The adoption question here is: “What proportion of the Internet’s user base performs DNSSEC validation?” The measurement we undertake at APNIC Labs uses a sampling technique, drawing in sample measurements from a broadly-based large-scale end-user measurement system based upon measurements made within online Ad impressions.

The result is certainly encouraging, in that some 30% of the Internet’s user population performs DNSSEC validation to the point that they are unable to resolve a badly signed DNS name.
The rise of validation rates across the Internet is not exactly uniform, and the interruption of the rise of adoption rates coincides with the first roll of the root key of DNS, the Key-Singing Key of the root zone. It’s useful to understand the composition of this number in terms of resolvers. DNS resolution is generally performed by resolvers that are operated by the user’s Internet Service Provider (ISP). The same measurement technique shows that some 85% of all users simply use the ISP-provided default DNS settings and pass their queries onto the ISP’s DNS resolvers (https://stats.labs.apnic.net/rvrs). These ISP resolvers do not uniformly perform DNSSEC validation. Some of the ISP’s resolvers perform DNSSEC validation, such as COMCAST’s DNS in the United States (with an approximate 35% market share) or DTAG’s resolvers in Germany, with a similarly significant market share of users within Germany. However, that remaining 15% of Internet users that don’t use their ISP’s own resolver infrastructure are serviced by the “open resolver” collection. This open resolver space is dominated by Google’s 8.8.8.8 public DNS service and Cloudflare’s 1.1.1.1 DNS service. Both of these open resolver services perform DNSSEC validation, which is a significant driver behind this validation rate. In terms of DNSSEC validation, approximately one-half of this 30% number can be attributed to the Google and Cloudflare services.
If we are prepared to suspend disbelief and accept that some 40% of DNS names are DNSSEC signed and relate this to the observed 30% of users who perform DNSSEC validation, then you might expect DNS validation to be a significant part of today’s DNS environment. Up to one-eighth of the use of the DNS might include DNSSEC validation if DNS queries were uniformly spread across the name space.
But that’s just not the case.
The distribution of use of DNS names is heavily skewed, and some names are highly used while the overall majority are hardly used at all. It’s a classic “heavy tail” distribution. Using query name data from Cloudflare’s open recursive resolver to illustrate this point, almost half the queries observed at this recovery relate to the .com TLD.
| TLD | % delegated queries | Cumulative |
|---|---|---|
| com | 46.07% | 46.07% |
| net | 12.22% | 58.30% |
| arpa | 8.58% | 66.88% |
| org | 2.64% | 69.51% |
| ru | 1.49% | 71.00% |
| io | 1.44% | 72.44% |
| de | 1.08% | 73.53% |
| cn | 1.02% | 74.54% |
| br | 0.97% | 75.52% |
| me | 0.62% | 76.15% |
| uk | 0.61% | 76.75% |
| xyz | 0.59% | 77.34% |
| to | 0.59% | 77.34% |
| au | 0.57% | 77.50% |
| co | 0.49% | 78.99% |
| jp | 0.48% | 79.47% |
| pl | 0.43% | 79.90% |
| nl | 0.40% | 80.34% |
| fr | 0.39% | 80.69% |
| ir | 0.38% | 81.07% |
This query distribution illustrates that a simple population count of domains to indicate the use of domain names can be misleading. Just three top-level domains account for two-thirds of the observed DNS queries at this recursive resolver. Within each top-level domain, it’s likely that we will observe the same heavy-tail distribution, where a small number of domain names account for the majority of queries within that top-level domain.
While a top-level domain might operate as a DNSSEC-signed zone, that does not mean that all second-level names within the zone are similarly DNSSEC-signed. As we have observed already, a little under 4.5% of .com second-level domains are DNSSEC-signed. The domain names that are not signed include some of the larger digital actors, including google.com, amazon.com and microsoft.com, to name just a few.
This leads towards a metric of DNSSEC adoption, combining the query profile with DNSSEC validation. The question here is: “How many of the queries seen in the DNS resolution environment are queries about names that are DNSSEC-signed?”
We’ve performed this analysis for Cloudflare resolver data, looking at each queried name and determining if the queried name is DNSSEC-signed. This leads to a query-weighted distribution of DNSSEC-signing. The results showing a comparison between signed and unsigned domain names in terms of query distribution are shown in Figure 6.
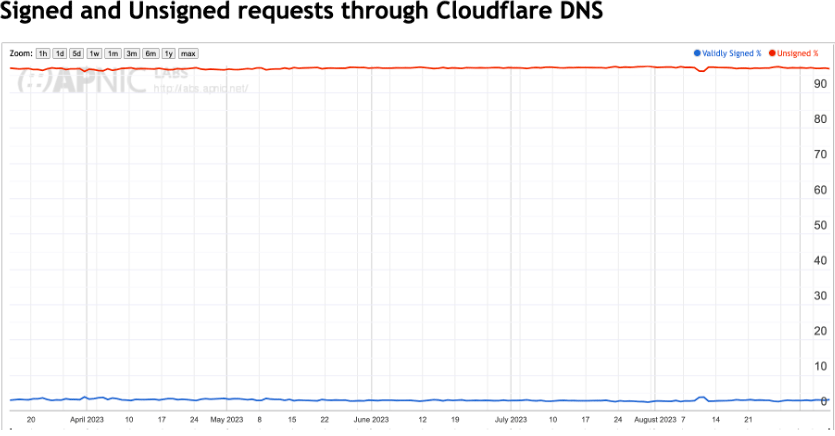
The daily value of this DNSSEC metric has been just below 3% since we commenced this measurement in March 2023.
What is behind this low number of DNSSEC adoption is the observation that most of the high-intensity query names are not DNSSEC signed. Here’s what we see from Cloudflare resolver data sets:
| Unsigned Name | % Unsigned Queries | Cumulative |
|---|---|---|
| googevideo.com | 1.94% | 1.94% |
| akadns.net | 0.92% | 2.86% |
| cloudfront.net | 0.77% | 3.63% |
| microsoft.com | 0.71% | 4.34% |
| direct.quickconnect.to | 0.68% | 5.02% |
| toktokv.com | 0.53% | 5.55% |
| googleapis.com | 0.53% | 6.08% |
| toktokcdn.com | 0.51% | 6.59% |
| apple.com | 0.5% | 7.09% |
| icloud.com | 0.47% | 7.56% |
| trafficmanager.net | 0.45% | 8.01% |
| amazonaws.com | 0.40% | 8.41% |
| google.com | 0.39% | 8.80% |
| gstatic.com | 0.34% | 9.14% |
| fna.fbcdn.net | 0.30% | 9.44% |
| amazon.com | 0.28% | 9.72% |
| live.com | 0.26% | 9.98% |
| websitewelcome.com | 0.26% | 10.24% |
| gtv1.com | 0.25% | 10.49% |
| nflxso.net | 0.25% | 10.74% |
The large content and cloud providers, including Google, Akamai, Microsoft, Apple and Amazon, do not DNSSEC-sign their services, and these services form a dominant subset of the overall DNS query profile.
Cloudflare operates a DNSSEC-validating recursive resolver, so unless the query is marked with a Checking Disabled flag, all queried domain names are DNSSEC-validated if they are DNSSEC-signed. If the same measurement was taken at a non-validating recursive resolver, then, of course, none of these names would be DNSSEC validated. From Cloudflare’s recursive resolver perspective, all of these DNSSEC-signed query names would be DNSSEC-validated. But this can provide an insight into the larger DNS environment if we take into account the observation that some 30% of users are behind DNSSEC-validating recursive resolvers. If 3% of queries are queries to DNSSEC-signed names, and 30% of such queries trigger DNSSEC validation, then we could characterise the overall adoption of DNSSEC in the use of the DNS at some 1% of all DNS queries.
From this perspective, the adoption of DNSSEC is not at 70%, or even 40%. The extent to which DNSSEC is used in the DNS name resolution environment is around some 1% of all DNS query traffic. From this perspective, there is a long way to go for broader DNSSEC adoption.
The basic question at this point is why are these highly used DNS names, not DNSSEC signed? It appears that for many of these large service operators, the additional costs and risks in using DNSSEC don’t offset the potential benefits.
It’s easy to see DNSSEC as a case of one more thing going wrong in the DNS. For DNS zone administrators, it’s another set of zone administration tasks, adding key management, regular key updates, key rollover, and coordination of keys with the parent zone and delegated zones. DNS responses are also larger, due both to the additional of digital signatures that are attached to DNS responses and the need to transmit the zone keys to the validating client in DNS responses. DNSEC response sizes are a major issue for the DNS. DNS over UDP is meant to fit DNS responses within 512 bytes. Adding DNSSEC digital signatures to a response may cause the response size to exceed this limit. DNS queries need to use EDNS extensions to indicate their capability to handle large UDP responses. However, once the response size starts to exceed the general MTU size limits then either the server and client have to confront the issues with packet fragmentation, or the server has to signal truncation and signal to the client to retry over TCP. This adds both delay and overhead to the DNS transaction.
Most end systems do not perform DNSSEC validation. They rely on their DNS resolver to perform DNSSEC validation on their behalf, and they implicitly trust in the resolver to perform this with appropriate levels of integrity. Of course, the issue here is that a man-in-the-middle attack between the end host and the validating resolver is still potentially effective: the end host is not validating the DNS response and cannot detect if a response is genuine or if it has been tampered with.
DNSSEC is not simple, either in design or in operations. There is much to get right and very little in the way of tolerance if errors occur. This adds to the fragility of the DNS. So, if we again ask the question about the value of DNSSEC, then the answer is unclear.
The overall impression from this negative perspective is that DNSSEC is half-cooked. It is not a clean synthesis of security and DNS functionality but a rather awkward and clunky tweak placed in an uncomfortable manner on top of the DNS. The incremental costs and fragility of DNSSEC far outweigh the potential benefit of risk mitigation from a rather obscure threat model.
So, if the question is: “Is there any near-term prospect that the operators of these highly popular services, such as Google, Amazon and Microsoft, will change their mind about DNSSEC-signing their zone?” then I don’t think that the prospects are looking all that good. From their perspective, I would guess that their estimation of the marginal benefits that DNSSEC-signing would provide are insufficient to outweigh the incremental performance cost and operational risks associated with using a DNSSEC-signed DNS name. So, when I look at that steady line in Figure 6, where just 3% of queries are being directed to DNSSEC-signed zones for the past six months, then I don’t think anything is going to change anytime soon for this particular metric of DNSSEC adoption.
APNIC Labs will continue to track this metric of query-weighted DNSSEC adoption. The report at https://stats.labs.apnic.net/cfdnssecdata, showing both the overall counts of queries to signed and unsigned DNS names and the most highly queried names in both categories, will continue to be updated on a daily basis.
Sponsored byIPv4.Global

Sponsored byVerisign

Sponsored byCSC
Sponsored byVerisign

Sponsored byWhoisXML API

Sponsored byRadix

Sponsored byDNIB.com


A World-Renowned Source for Internet Developments. Serving Since 2002.