
Welcome:
Login
|
Sign Up
|
About CircleID
Follow:
|
|
|


|
||
|
||
Here are the mid-year trends of the the .COM Top Level Domain. Our analysis is based on data transmitted by Verisign, the company tasked with the management of .COM, to ICANN, as of 30/06/23.
To conduct our study, we will be using two performance indicators taken from the reports sent by Verisign to ICANN and published in its ‘Registry transactions Reports’1: stocks at 30/06 and 31/12 of each year and monthly creations consolidated over a 12-month period.
Based on these two official indicators, we can calculate the others: the volume of names retained and deleted over the last 12 months, the stock change, create and delete operations, the creation rate and retention rate.
.COM create operations experienced a particularly prosperous period between Q3 2020 and Q4 2021, with a quarterly rate of over 10 million and a spike of 11 million in Q2 2021. They fell below 10 million again since Q1 2022, with a rebound in 2023.
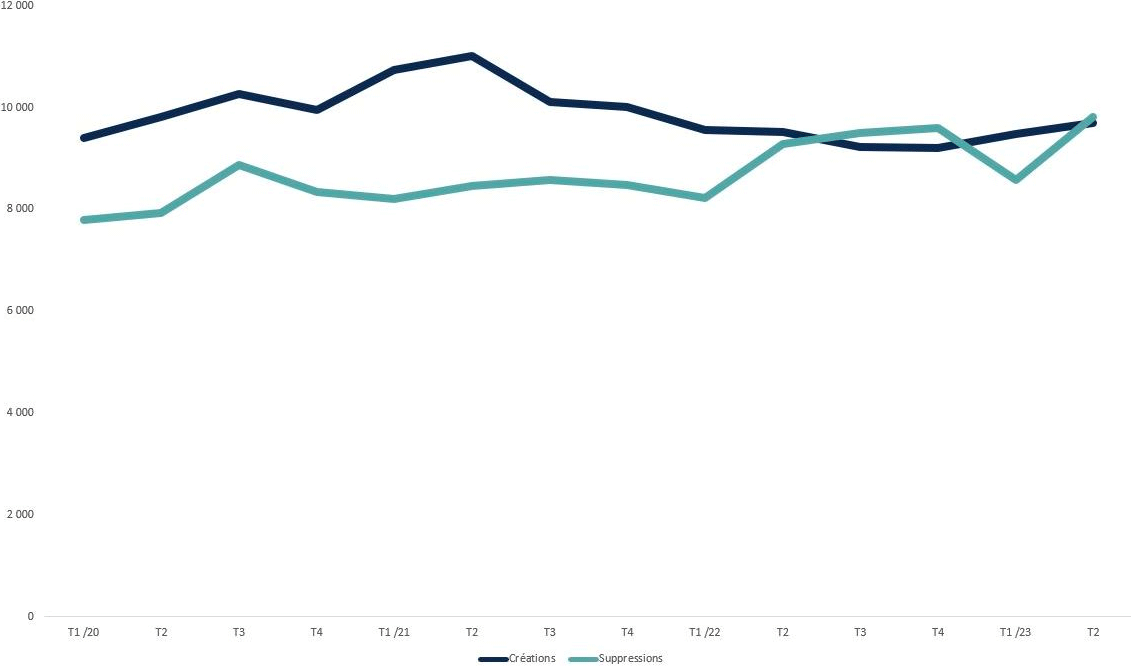
Delete operations have kept pace with create operations, as usual, with a one-year time lag (in addition to the Grace Period). Thus create operations at the end of 2020 and early 2021 are reflected in an increased delete rate as of Q2 2022, reaching over 9 million before dropping again in Q1 2023. This phenomenon is par for the course and did not arouse particular concern. Nevertheless, Q2 2023 has shown an unexpected return of delete operations, which should, theoretically, have stood at around 8-9 million but which, in fact, are closer to 10 million.
This trend has impacted the Q2 2023 net balance, which is slightly down on Q1 2023, to all appearances restoring the pre-2022 dynamic. These unexpected fluctuations make it difficult to predict performances for the second half of 2023. In principle, .COM should be in the black, but the high level of deletions may reflect a fragility linked to increased numbers of non-renewals due to the fee rises.
The create rate2 has followed more or less the same pattern, dropping drastically as of the start of 2022 and stabilizing in 2023. It is still too early to predict a recovery and to what degree.
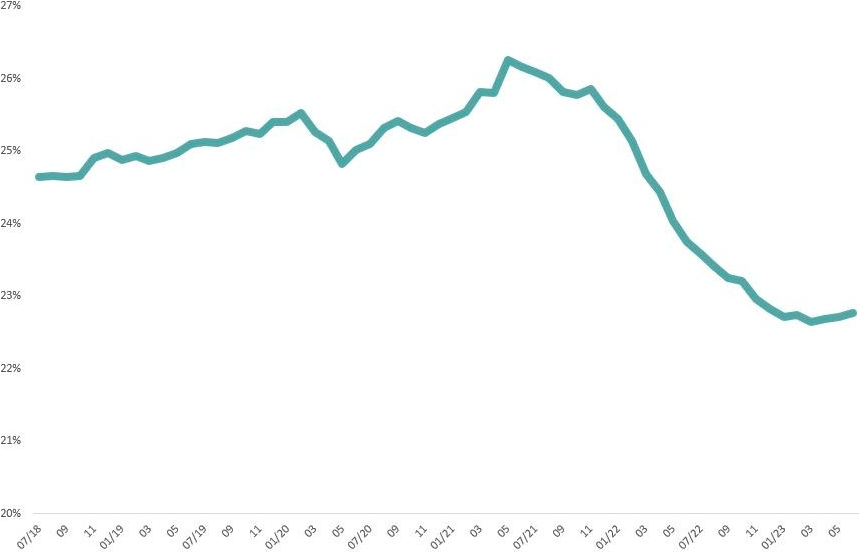
Having long remained within the 77.5% – 78.5% bracket, the retention rate for .COM dropped below 77.5% in Q1 2023 and continued on the decline under way since Q3 20223.
Despite their spectacular character, changes to KPIs for the .COM TLD in 2021/2022 were similar to those for the other major ccTLDs boosted by COVID in 2020/2021 before coming down to a relatively hard landing in 2022.
We previously examined Verisign’s strategic options in our October 2022 article. It is likely that performances in the second half of 2023 will confirm or rebut our analyses while also identifying the directions taken by the company’s strategists. Verisign’s Third Quarter Report shows a net decrease of 0.5 million .COM and .NET during the third quarter. For now, the priority seems still to be offsetting the decline in volumes by raising fees, a choice that may prove risky if this exacerbates the decline.
To read the full post (free access) and detailed data, especially on fee changes.COM and .NET, click here.
Sponsored byRadix

Sponsored byDNIB.com

Sponsored byCSC
Sponsored byWhoisXML API

Sponsored byIPv4.Global

Sponsored byVerisign

Sponsored byVerisign


A World-Renowned Source for Internet Developments. Serving Since 2002.