
Welcome:
Login
|
Sign Up
|
About CircleID
Follow:
|
|
|


|
||
|
||
Afnic, the association in charge of the .fr domain and several other French overseas and generic Top-Level Domains, has published the 2023 edition of its annual observatory report “The global domain name market” containing all of the latest key figures and trends in the TLD market.
Key figures for 2023:
At year-end 2023, the global domain name market represented some 368 million domain names. The growth surge of last year (+2.9% in 2022 vs. 2021; +0.9% in 2021 vs. 2020; +1.3% in 2020 vs. 2019) has been maintained at +2.2% compared with 2022.
Yet this performance is misleading due to a very limited number of domains that experienced significant fluctuations.
.com recorded its worst year yet with three negative quarters, particularly Q4, a situation that does not bode well for 2024. With 163 million .com names at the end of 2023, the TLD has lost 1 million names since last year, i.e., a -0.7% fall compared with 2022. The decline of the .com TLD has, therefore, continued on the back of last year’s low growth (+1.1%) and compared with the +5.8% increase in 2021 vs. 2020 and +4.4% in 2020 vs. 2019.

While it may still be the market leader—with a 44% share of the global domain name market, down 2 points compared with 2022 and accounting for 85% of all Legacy TLDs—.com is facing various difficulties:
In addition to .com, there are now 17 Other Legacy TLDs, or ‘traditional’ domains created before 2012: .aero, .asia, .biz, .cat, .coop, .info, .jobs, .mobi, .museum, .name, .net, .org,
.post, .pro, .tel, .travel and .xxx. For Other Legacy TLDs, users are less and less interested in these domains, which were presented at the time of their creation in 2001 as alternatives to the approaching saturation of the .com domain.
There were just over 31 million Other Legacy TLDs at year-end 2023, up slightly by +0.5% compared with 2022 on the back of the declines of the previous years (-0.8% in 2022 vs. 2021; -0.7% in 2021 vs. 2020; -1.8% in 2020 vs. 2019).
Other Legacy TLDs are, therefore, showing a certain stability as a whole, but their individual situations are highly contrasted. All of the five largest Other Legacy TLDs in terms of volume (.biz, .info, .mobi, .net, .org) lost stock except for .org (+1%). The performance of the others ranges from 0% for .info to -9% for .biz and .mobi. Some of the others posted strong growth, such as .asia (+52%) and .pro (+55%), doubtless thanks to their aggressive promotional campaigns or “domaining” waves.
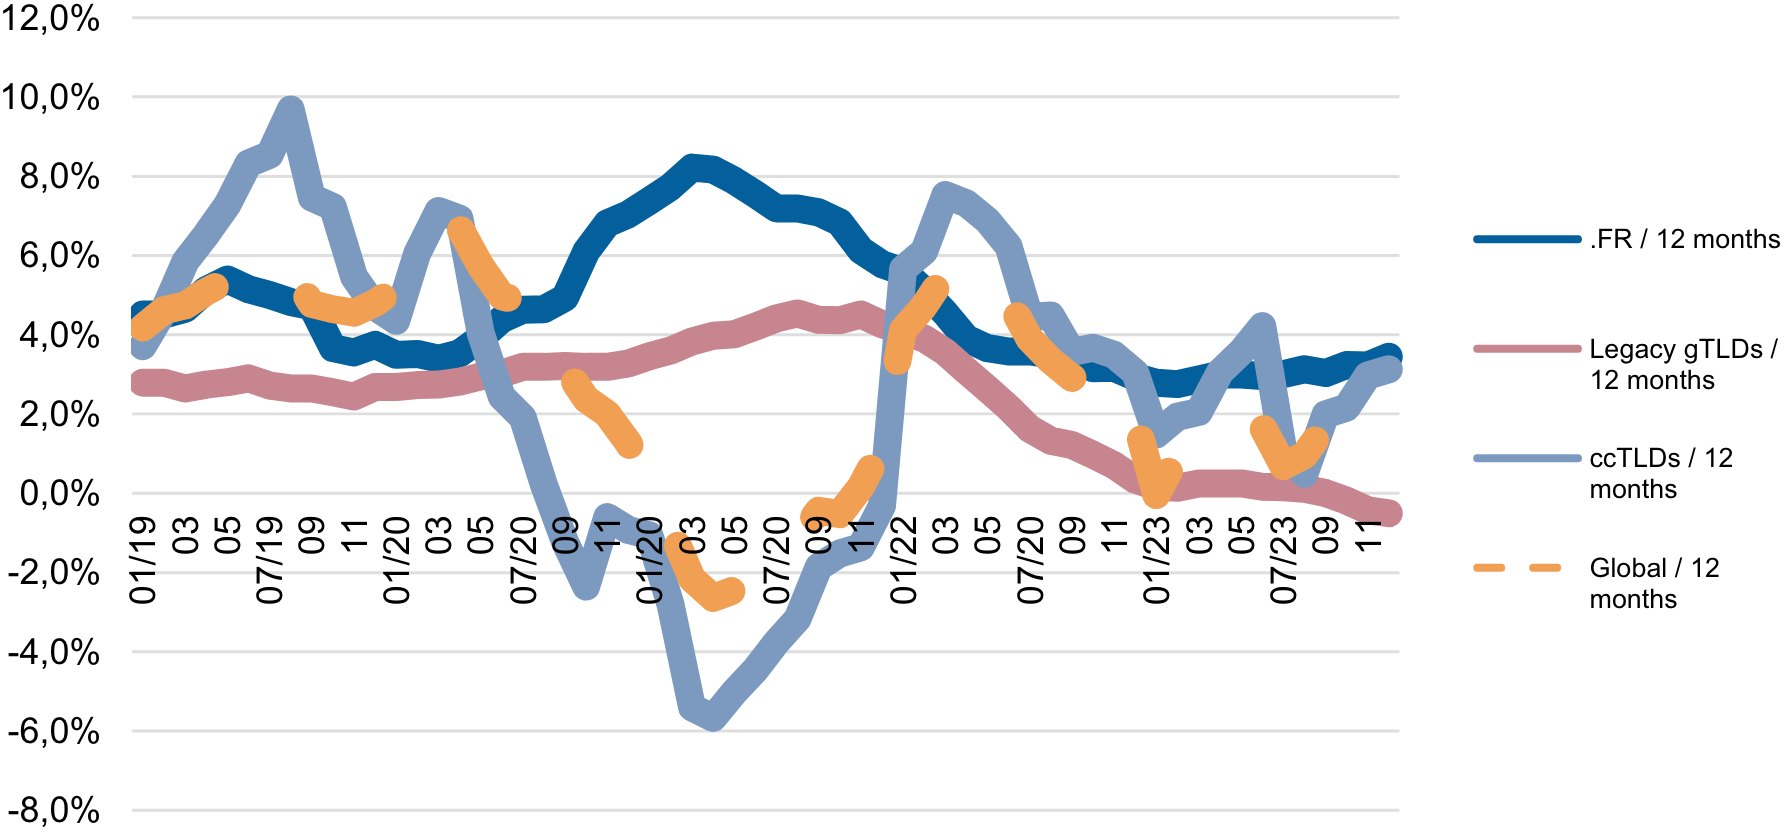
ccTLDs are country domains, like .fr. In total, there were 138 million domain names registered under ccTLDs at year-end 2023, an increase of +3.0% compared with 2022—stunted growth, albeit, compared with 2022 (+7.1%) but positive, unlike in previous years (-3.8% in 2021 vs. 2020 and -0.9% in 2020 vs. 2019).
Contrary to 2022, a year in which the overall figure did not reflect the reality of most ccTLD registries due to the influence of some large domains, regional dynamics were less contrasted in 2023, tending to converge towards the average.
Asia-Pacific continued to grow (+6.6% in 2023 vs. 2022) but at a slower pace than in 2022 (+23.4%), closely followed by Africa (+6.5% in 2023 vs. 2022). Latin America and North American form the second group (+2.9% and +2.4% respectively), while Europe comes in last at +1.3%.
These changes have consequences in terms of market share. In two years (2021-2023), Asia-Pacific has already gained 5 points at 29.5%, while Europe lost an equal number at 55.3%. The changes in the other regions were more modest: -0.1 points for North America (3.9%), -0.3 points for Latin America (8.9%), and +0.2 points for Africa (2.4%).
Despite a slowdown, ccTLDs still thrive best in Europe: out of 30 ccTLDs with over a million names, 17 are in Europe, 6 in Asia-Pacific, 3 in Latin America and the Caribbean, 2 in North America, and 2 in Africa.
nTLDs, or “new TLDs” created from 2014 onwards, encompass different segments, including geoTLDs (.bzh, .paris, .alsace, .corsica, etc.), TLDs corresponding to brands (.sncf, .mma, .leclerc, etc.), community TLDs and generic TLDs.
There were 35.6 million nTLDs at the end of 2023, representing a +16% increase compared with 2022, following the +7.2% increase in 2022 vs. 2021 and the two successive declines in 2021 (-9.4% vs. 2020) and 2020 (-1.0% vs. 2019). The historic peak in nTLDs reached in May 2020 at 35 million names was consequently surpassed in the wake of the continued rise in global stock since early 2023. nTLDs account for 10% of market share (+1 point compared with 2022).

Among the nTLD segments, generic nTLDs gained 16% in stock and 28% in create operations. Community TLDs lost -59% in stock (a consequence of the +268% spike in their create operations in 2022). Geographic TLDs lost -8% in stock but saw their create operations soar (+94%). Lastly, .brand TLDs gained +21% in stock, and their create operations increased by +133%.
It is important to note that 59% of new TLDs other than .brand had fewer than 10,000 names in portfolio, while only 1% had more than 500,000. For many of them (other than the .brand domains), these low volumes constitute a serious impediment to breaking even and financing their development, which reinforces the trend toward the consolidation of portfolios of nTLDs.
Download the full study:
Afnic study “The Global Domain Name Market in 2023”
Sponsored byDNIB.com

Sponsored byWhoisXML API

Sponsored byVerisign

Sponsored byIPv4.Global

Sponsored byRadix

Sponsored byVerisign

Sponsored byCSC

A World-Renowned Source for Internet Developments. Serving Since 2002.