
Welcome:
Login
|
Sign Up
|
About CircleID
Follow:
|
|



|
||
|
||
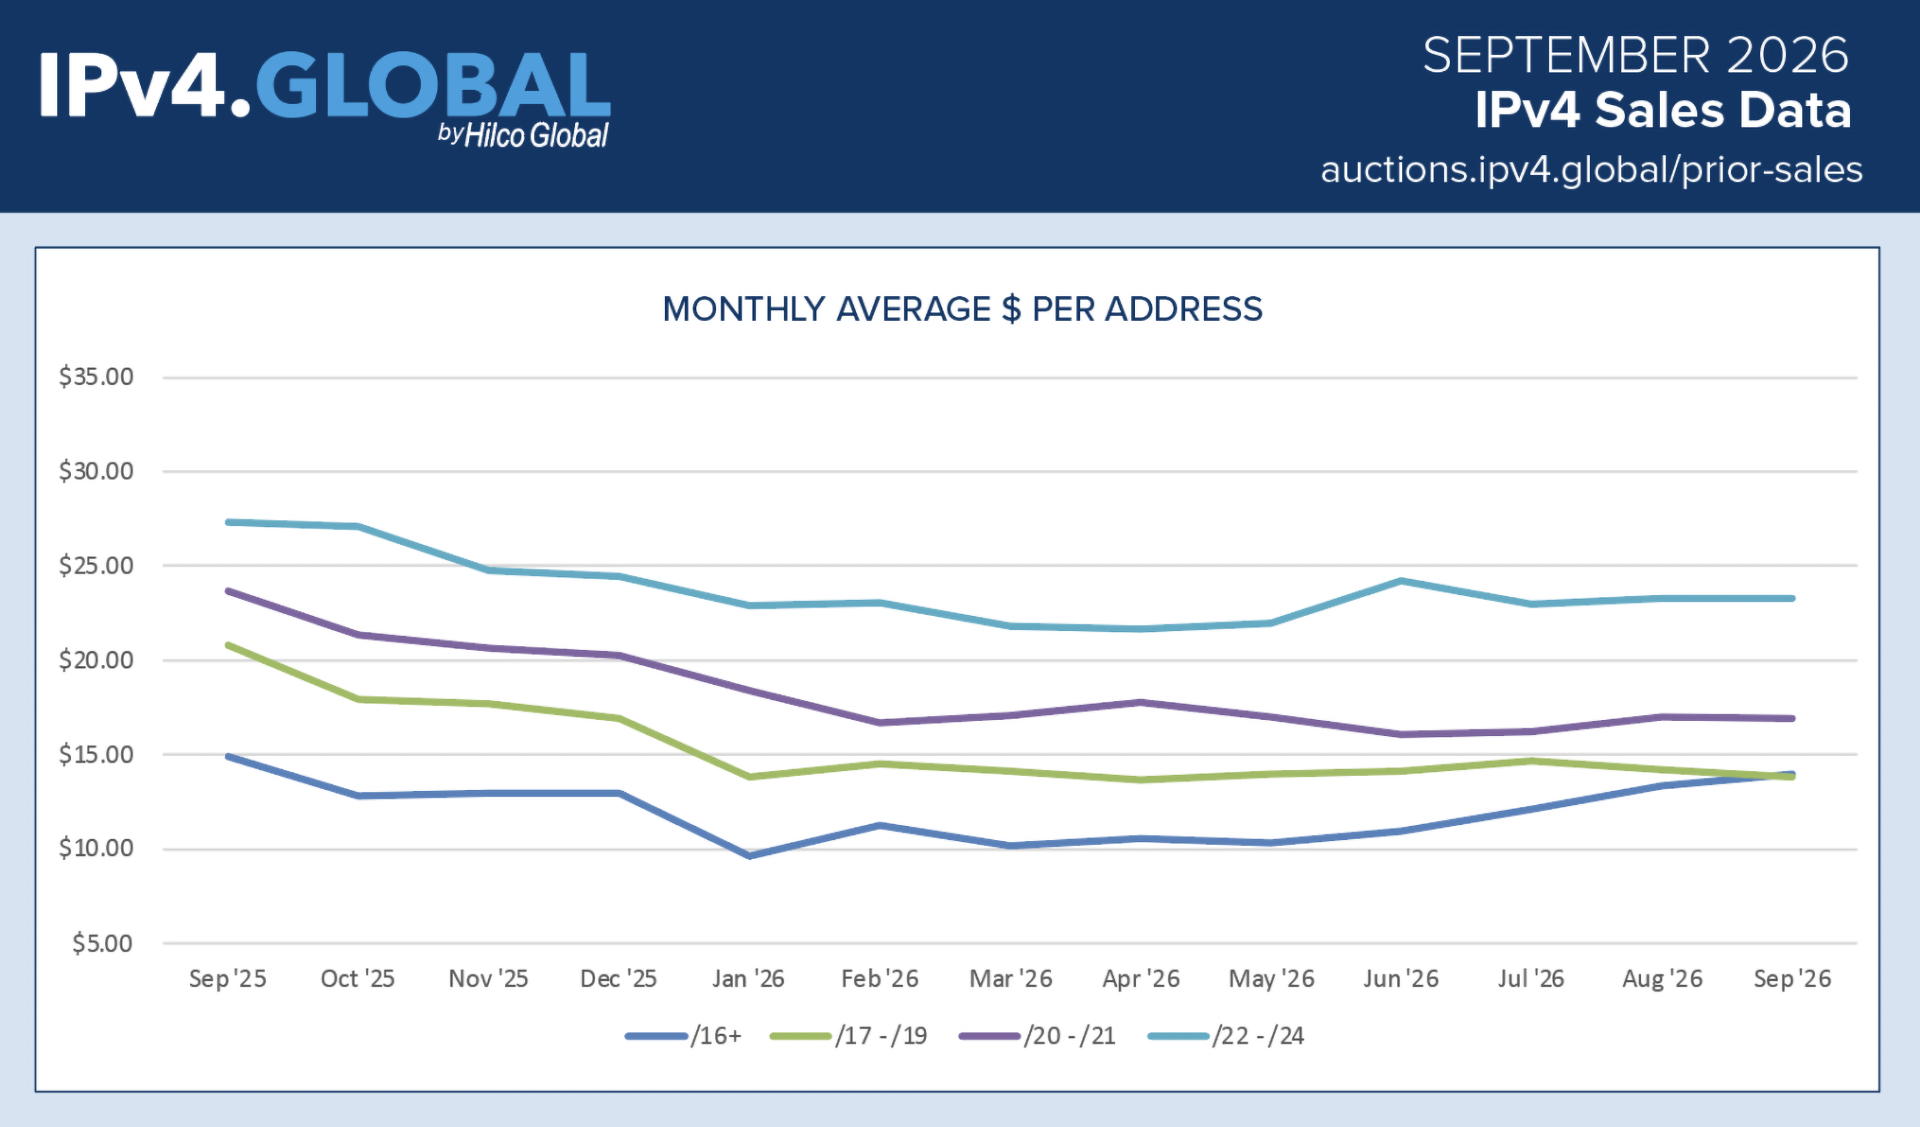
This analysis draws on IPv4.Global’s September 2026 market report, examining pricing trends, tightening supply and the implications of large-block recovery for buyers, sellers and investors.
September’s IPv4 sales data shows a narrowing price gap between larger allocations and the next size category. Blocks of /16 and larger continued to recover, reaching approximately $14 per address, close to the average for /17 – /19 blocks. Other categories were broadly unchanged or slightly weaker, indicating that the recovery remains uneven.
The large-block discount has narrowed substantially. The accompanying chart tracks monthly averages from September 2025 through September 2026. Prices for /16 and larger blocks rose from approximately $10 per address in May to roughly $14 in September. Over the same period, /17 – /19 prices changed little overall, then eased from around $14.50 in July to approximately $14 in September. The gap between these categories, almost $6 a year earlier, has effectively disappeared at the chart’s level of precision.
That convergence has a specific scope. September averages remained approximately $17 for /20 – /21 blocks and $23 for /22 – /24 blocks, both little changed from August. Smaller allocations therefore retained substantial per-address premiums. Large-block pricing is approaching the adjacent category’s average, while remaining well below the prices recorded for the smallest blocks.
Every category remained below its September 2025 average. The chart shows broad declines through late 2025 and early 2026, followed by stabilization and differing recovery paths. The clearest sustained gains since May have occurred in /16 and larger blocks. September consequently represents a recovery from recent lows, with substantial differences in momentum across the market.
The progression is consistent with the supply conditions described in IPv4.Global’s earlier reports. The June analysis identified tightening inventory and increased buyer competition. The July report described continued transaction activity as prices firmed, while the August analysis emphasized limited availability of desirable contiguous allocations. These reports point to persistent operational demand meeting more constrained supply. September’s pricing is consistent with that interpretation, although the chart alone cannot establish its causes.
For network operators, the changing discount strengthens the case for comparing current acquisition options. A single large allocation and several smaller blocks can differ in availability, deployment requirements and total cost. Registration history, routing characteristics and transaction structure also influence value. Sellers and investors should similarly assess recent comparable transactions rather than apply the strongest segment’s recovery across an entire portfolio.
The figures combine online and private sales, including some negotiated bundles, and reflect agreement dates rather than completed transfers. Changes in the transaction mix can affect monthly averages; the chart does not establish transaction volumes or inventory depth.
Entering the final quarter of 2026, further large-block appreciation remains plausible if suitable inventory stays constrained and buyer participation holds. Additional supply could moderate gains.
Sponsored byIPv4.Global

Sponsored byVerisign

Sponsored byCSC

Sponsored byRadix

Sponsored byWhoisXML API

Sponsored byDNIB.com

Sponsored byVerisign


A World-Renowned Source for Internet Developments. Serving Since 2002.