
Welcome:
Login
|
Sign Up
|
About CircleID
Follow:
|
|
|


|
||
|
||
Many previous pieces of research have focused on the desirability of a comprehensive scoring system, to be used for ranking results identified as part of a brand-protection solution, according to their potential level of threat. Such scoring systems offer the capability for identifying prioritised targets for further analysis, content tracking or enforcement actions1, 2
In a recent Stobbs study3, we considered the case of a basic scoring system for domain-name results—a key category of findings because of the possibility for relatively comprehensive monitoring, the high online visibility of related infringements, the explicit nature of any associated IP abuse and the greater range of options for enforcement4. The algorithm presented in the initial study focused on characteristics of the domain name itself, taking account of factors such as the location and context within the domain name of the brand name of interest, the presence of relevance or non-relevance keywords, and the proportion of the domain name composed of other characters. This technique allows for an initial filtering of the list of candidate domain names of interest, and can be augmented by a second stage of filtering to take account of the content of any associated webpage, considering factors such as the number and prominence of mentions of the brand name, and the presence in the site content of relevance keywords.
What this initial algorithm does not encompass is any consideration of other technical or configuration factors associated with the domain, comprising any of a number of features which can also provide some indication of its likely potential level of risk. Examples of such characteristics considered in previous studies include the TLD (top-level domain, or domain extension) (working on the basis that some TLDs are more popular with infringers than others, due to factors such as cost, ease of registration, the presence of IP protection programmes, and the ease of enforcement)5, and the host IP address (based on the assertion that websites hosted at (or near) IP addresses containing a large number of other ‘bad’ or blacklisted websites are themselves more likely to pose a risk)6.
Overall, the set of relevant potential characteristics for assessing possible risk include the TLD, and the identity of associated domain service providers such as the registrar, hosting provider and nameserver host. These types of providers are typically associated with differing levels of ‘trust’, connected to factors such as compliance to enforcement requests and popularity with infringers7. As such, the use of a provider showing a greater degree of association with previously known ‘bad’ sites arguably provides an indication that any other arbitrary site associated with the same provider is—other factors being equal—more likely to be associated with greater degree of risk.
The basic methodology for constructing a threat-score algorithm on this basis thereby involves collating a large database of known bad sites (identified by—for example—comparison of website templates with those used by previously identified infringing sites, or by analysis and verification (as infringing) of results identified through a brand monitoring service), and extracting the features of interest for these known ‘bad’ sites. This process makes it possible to create ‘league tables’ of the top features and providers which tend more frequently to be associated with infringing sites.
One key point to note, however, is that merely the association of large numbers of infringing sites with a particular domain characteristic does not necessarily mean that that characteristic conveys higher risk. One particular reason why this may be the case is that certain characteristics are simply more common generally, and would therefore be associated with larger numbers of ‘bad’ sites even if the rate of association (i.e. the number as a proportion of the total) with such sites was not disproportionate. As an illustration of this point, we can consider the TLD; the .com domain extension, for example, will generally always be associated with large numbers of infringements, due simply to the large total number of domains registered on this extension. Accordingly, there will normally be a requirement to ‘normalise’ the raw numbers, by dividing the number of observed infringements by the total numbers of registered domains associated with the same instance of the particular feature (i.e. in the case of TLD, the total number of registered .com domains), to generate a measure of infringement frequency or ‘hit rate’ associated with the instance in question. Domain characteristics with greater infringement frequencies are generally more likely to be associated with higher risk.
In order to be able to carry out this type of analysis, it is necessary to compile ‘look-up tables’ of the (proportion of the) total numbers of registered domains which are associated with each possible option, for each feature of interest—i.e. ranked lists (by total (or relative) numbers) of the possible domain TLDs, registrars, hosting providers and nameserver hosts. The remainder of this article considers the process of compiling these lists and is illustrated by tables of the top entries (i.e. the most commonly-appearing options within the datasets) in each case. Whilst this has clear applications in threat scoring, it can also provide general insights in its own right, in terms of showing general trends within the domain name landscape.
The total numbers of domains by TLD is a relatively simple statistic to obtain, as it can be trivially extracted from analysis of domain name zone files (at least for gTLDs (i.e. generic TLDs), for which the corresponding registries publish the data files and make them publicly accessible). A more comprehensive dataset (with significant additional ccTLD (i.e. country-code TLDs) coverage) is that provided by DomainTools8, from which the top ten TLDs are shown in Table 1.
| TLD | No. domains | % of dataset |
|---|---|---|
| .com | 155,728,200 | 43.86% |
| .de | 17,378,724 | 4.89% |
| .net | 12,346,352 | 3.48% |
| .cn | 11,975,245 | 3.37% |
| .org | 11,226,231 | 3.16% |
| .uk | 9,752,126 | 2.75% |
| .nl | 5,973,733 | 1.68% |
| .ru | 5,795,959 | 1.63% |
| .top | 5,326,770 | 1.50% |
| .br | 4,989,115 | 1.41% |
For domain registrars, the ideal statistic would be the total numbers of domains under management by each registrar. One estimate of this total statistic is that provided by DomainNameStat9, although some degree of ‘post-processing’ is required in order to obtain a ‘clean’ dataset, due to the existence of a range of variations by which some of the individual distinct registrars are referred to (e.g. with or without ‘.com’, ‘Inc.’, ‘Ltd’, ‘LLC’, and the existence of other variations—e.g. there are over 1,200 distinct entries for DropCatch.com in DomainNameStat’s list, mostly of the form ‘DropCatch.com XXX LLC’, where ‘XXX’ is a three- or four-digit string). The ‘cleansed’ list consists of over 1,100 distinct entities, of which the top ten are shown in Table 2.
| Registrar | No. domains | % of dataset |
|---|---|---|
| GoDaddy.com | 87,123,338 | 26.93% |
| NameCheap | 24,389,502 | 7.54% |
| Tucows Domains | 13,256,889 | 4.10% |
| Squarespace Domains | 12,352,131 | 3.82% |
| Dynadot | 9,019,705 | 2.79% |
| NameSilo | 7,393,306 | 2.29% |
| GMO Internet Group, Inc. d/b/a Onamae.com | 7,268,309 | 2.25% |
| IONOS | 6,749,280 | 2.09% |
| Gname.com | 6,659,851 | 2.06% |
| HOSTINGER operations | 6,055,416 | 1.87% |
As a ‘sanity-check’, it is informative to compare these statistics with those identified through an explicit look-up process. In order to reduce the number of look-ups required, though still maintaining a representative sample of the overall domain universe, we consider a set of domains taken by extracting each 500th domain from each of the domain name data zone files. Broadly, domains are contained within the individual zone files in alphabetical order, so this equally-spaced sample should essentially provide a ‘random’ representative set of domains, which should not correlate obviously with any other characteristic. The only significant bias is that the zone-file analysis will exclude ccTLD domain results.
The sampling process described above generates a dataset of just under half a million domains (actually around 484,000), from the total set of around 350 million registered domains. Carrying out a whois look-up on each domain in the sample dataset (where information is available on an automated basis) makes it possible to extract the registrar identity in around 390,000 cases. Following a similar data ‘cleansing’ process to that described previously, the top ten registrars from this dataset are shown in Table 3.
| Registrar | No. domains | % of dataset |
|---|---|---|
| GoDaddy.com | 116,640 | 29.80% |
| NameCheap | 28,389 | 7.25% |
| Squarespace Domains | 17,511 | 4.47% |
| Tucows Domains | 17,007 | 4.34% |
| Network Solutions | 8,939 | 2.28% |
| IONOS | 8,802 | 2.25% |
| Gname.com | 8,431 | 2.15% |
| Dynadot | 8,155 | 2.08% |
| GMO Internet | 7,633 | 1.95% |
| GMO Internet | 7,633 | 1.95% |
| HOSTINGER operations | 6,474 | 1.65% |
Overall, there is a good degree of similarity between these two lists (i.e. that provided by DomainNameStat and that provided by the sampled zone-file dataset), and the datasets do correlate with each other very well (correlation coefficient = 0.9923) (Figure 1).
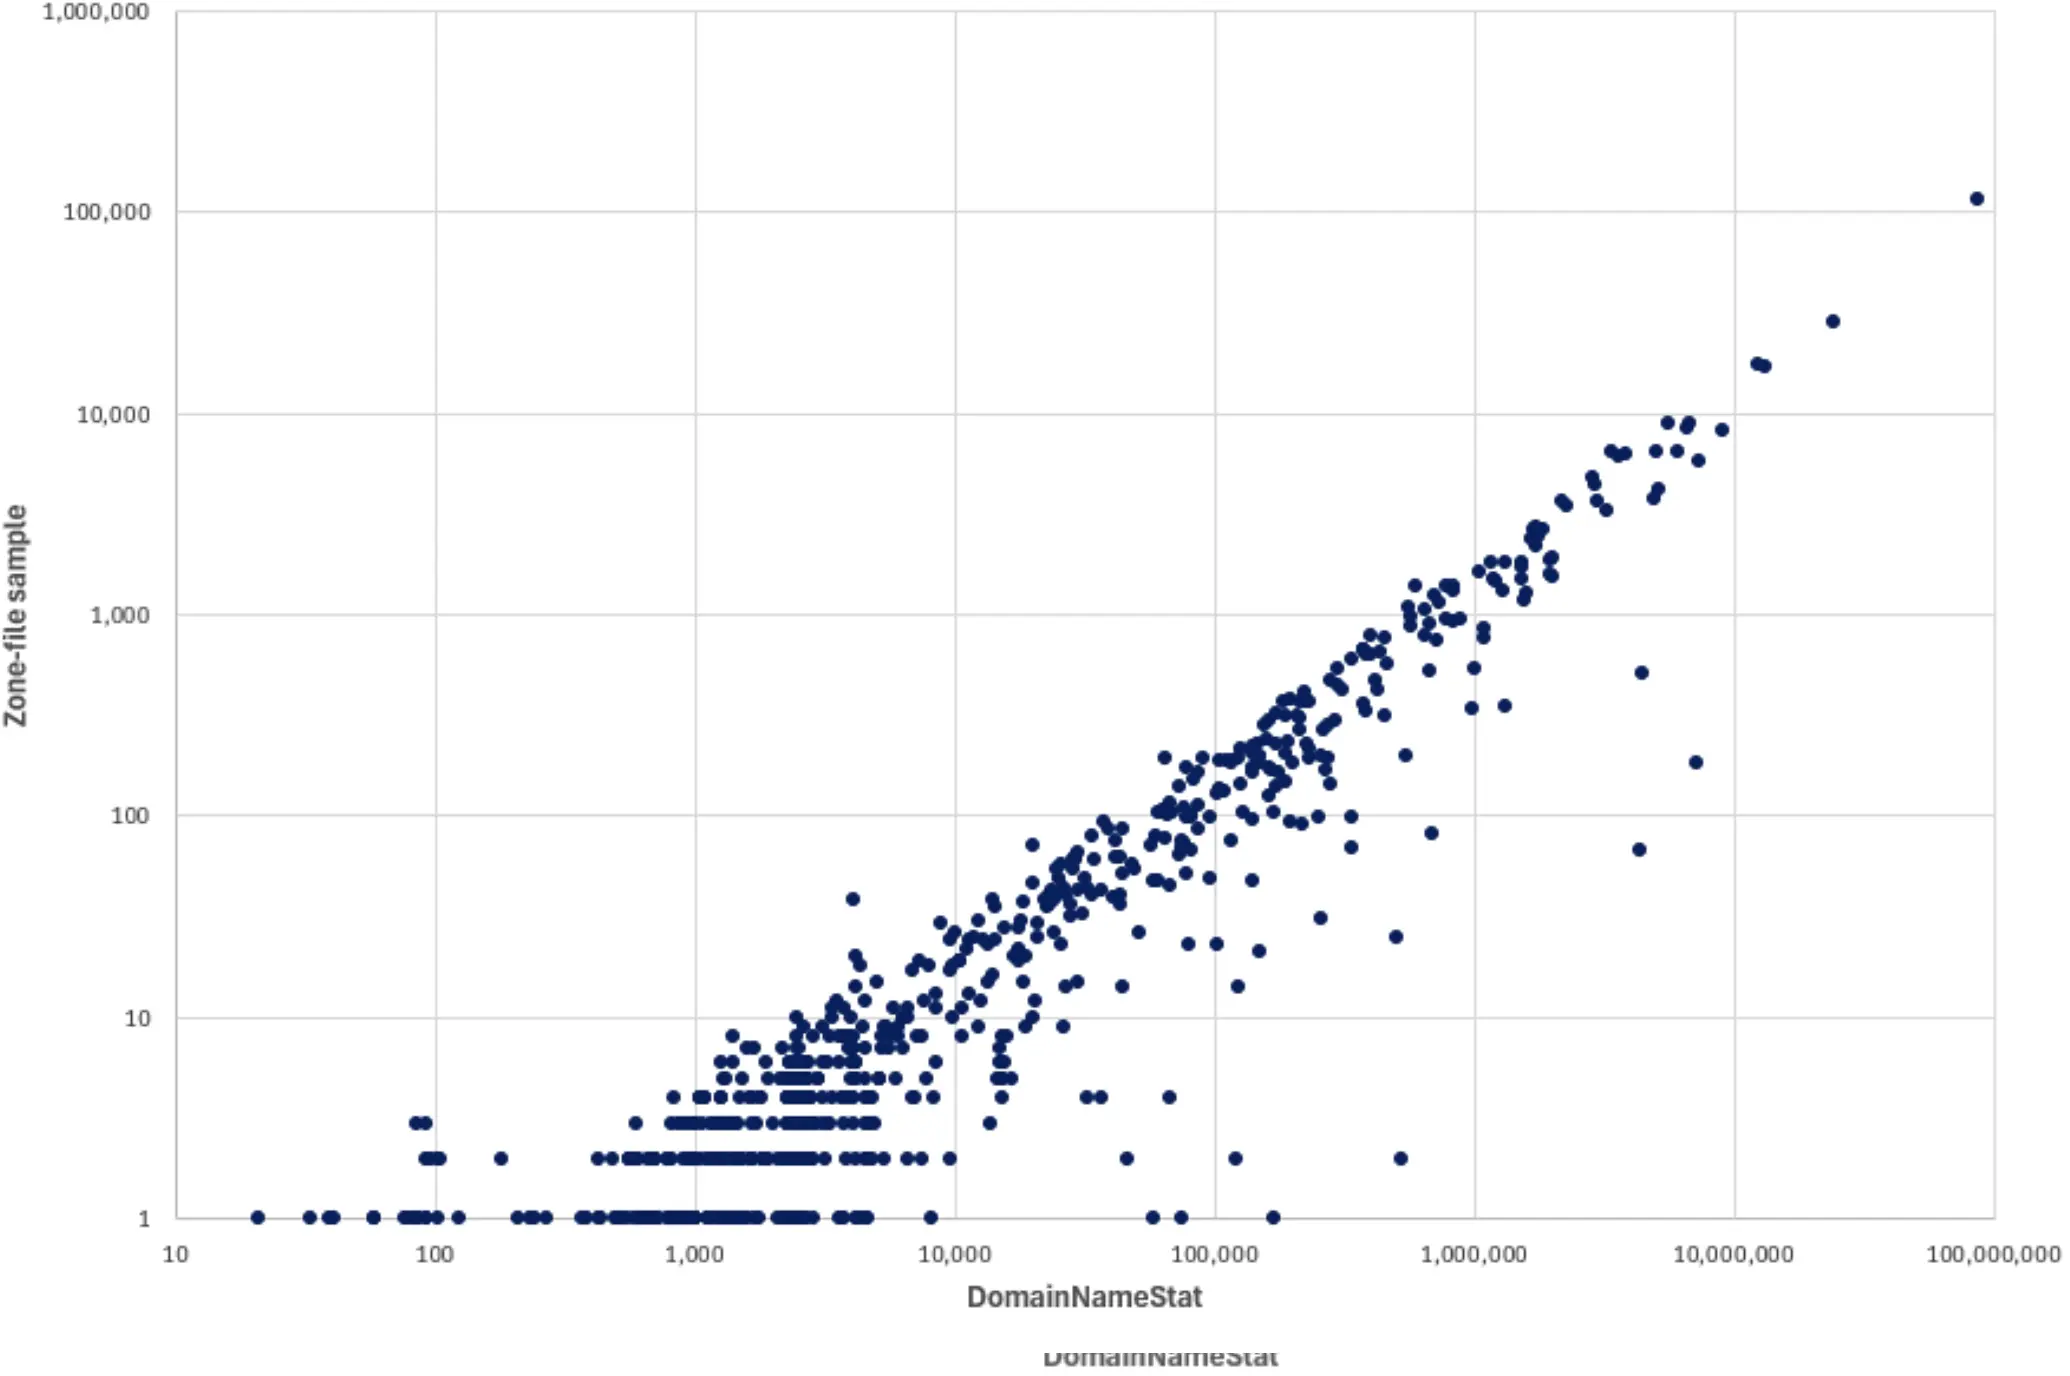
In this case, the statistics from DomainNameStat probably constitute a better dataset for use in threat scoring analysis (not least because of the vastly increased number of data points), but the high degree of correlation with the zone-file sample does provide some confidence that the latter dataset constitutes a robust data-source for analysis in extracting alternative domain features, such as those discussed below, in cases where no definitive third-party data overviews are available.
The nameserver host (defined as the domain name given as the end-section of the nameserver (NS) record for the domain in question—e.g. ‘cloudflare.com’ in the case of ‘aaden.ns.cloudflare.com’) can easily be extracted for any given domain via a simple whois look-up. The statistics given for this feature relate to the first (primary) nameserver record for each domain, based on the dataset obtained from the zone-file sampling exercise (Table 4).
| Nameserver host | No. domains | % of dataset |
|---|---|---|
| domaincontrol.com | 88,073 | 22.61% |
| cloudflare.com | 35,422 | 9.09% |
| googledomains.com | 16,290 | 4.18% |
| registrar-servers.com | 14,286 | 3.67% |
| wixdns.net | 11,344 | 2.91% |
| afternic.com | 10,278 | 2.64% |
| dns-parking.com | 9,082 | 2.33% |
| hichina.com | 7,250 | 1.86% |
| share-dns.com | 6,324 | 1.62% |
| namebrightdns.com | 6,251 | 1.60% |
The hosting provider for a domain is defined as the operator of the webserver associated with the (primary) IP address at which the domain is hosted. In this case, the ‘top’ hosting providers could be calculated on a per-IP address or a per-domain basis; however, in this analysis, the latter approach is taken (since, in general, different IP addresses will be associated with differing numbers of hosted domains, so a per-domain approach provides a more representative overview), again using the sampled zone file dataset (Table 5).
| Hosting provider | No. domains | % of dataset |
|---|---|---|
| Amazon | 115,151 | 37.22% |
| Cloudflare10 | 33,945 | 10.97% |
| Squarespace | 13,534 | 4.37% |
| Namecheap | 11,604 | 3.75% |
| 8,894 | 2.87% | |
| Shopify | 8,116 | 2.62% |
| GoDaddy.com | 4,918 | 1.59% |
| Unified Layer | 4,604 | 1.49% |
| PSINet | 4,398 | 1.42% |
| Newfold Digital | 4,298 | 1.39% |
Whilst the statistics presented in this article provide some insights regarding the sets of top domain service providers in their own right, the most obvious application is (using the full datasets in each case, rather than just the top-tens shown in this overview) as ‘look-up’ tables, for the purposes of normalisation of statistics of those features most commonly associated with infringing or otherwise ‘bad’ sites, as part of an overall threat-scoring approach. A fuller formulation of such an approach—which is key to identifying priority targets from (potentially very large) sets of brand-monitoring results—will also require a dataset of known ‘bad’ sites, which should itself be as large as possible so as to provide the most meaningful statistics. Ultimately, it is likely that other domain characteristics (such as registrant characteristics, SSL providers, etc.), in addition to other features such as the presence of MX records, web traffic, etc., will also feed into the construction of an overall comprehensive algorithm.
Sponsored byCSC

Sponsored byVerisign

Sponsored byDNIB.com

Sponsored byVerisign

Sponsored byRadix

Sponsored byWhoisXML API

Sponsored byIPv4.Global


A World-Renowned Source for Internet Developments. Serving Since 2002.